Previous in this series:
Market Analysis
SmartOptions’s market analysis defines and quantifies the global opportunity in options trading by breaking it down into the Total Addressable Market (“TAM”), Serviceable Available Market (“SAM”), and Serviceable Obtainable Market (“SOM”). The TAM represents the entire global population of investors who could potentially engage in options trading. The SAM narrows this focus to the subset of investors who are actively trading through online brokerages. The SOM further refines the opportunity to the specific group of retail traders that SmartOptions can realistically reach, primarily young, inexperienced, and undercapitalized individuals. Taken together, this market analysis quantifies the significant opportunity in the retail options trading market.
Total Addressable Market (TAM)
The estimated total number of global retail traders is 115 million reflecting a multi-trillion-dollar market spanning key regions such as the United States, India, and China, and other key markets. SmartOptions’ TAM would equate to 30 million traders, 26% of the retail trading market. In the U.S., approximately 130 million (53% of adults) households own stocks, comprising 100 million+ brokerage accounts with 30 million characterized as active retail accounts. By 2020, retail investors drove over 80% of China’s stock trades, while India captured 52% of global options volume in 2023 with 85 billion contracts; the U.S. followed with 11 billion and 11% growth (Statista, 2024; Goldman Sachs, 2021; WFE, 2024).
Table 3: Retail Options Traders TAM
| Region | Estimated Retail Traders (Millions) | Retail Options Traders (%) | Estimated Options Traders (Millions) |
| United States | 30 | 35% | 11 |
| Europe | 20 | 15% | 3 |
| Asia (India, China, S. Korea) | 50 | 40% | 20 |
| Latin America | 10 | 10% | 1 |
| Middle East & Africa | 5 | 5% | 0.2 |
| Global Total (Est.) | 115 | 26% | 30 |
Note: From Broadridge Financial Solutions, 2024; Einhorn et al., 2023; EFAMA, 2024; Financial Times, 2025; Funds Society, 2024; Euromonitor International, 2023
Serviceable Available Market (SAM)
The consensus among JP Morgan analysts is that 1 in 3 active retail traders trade options. For the U.S., this would equate to 10 million out of 30 million active retail traders (J.P. Morgan, 2024). A 2021 Charles Schwab survey supports this estimate indicating that over 11 million Americans actively trade options, which aligns with our 11 million TAM estimate (Schwab, 2021). Thus, the SAM consists of 11 million retail traders actively trading options and seeking educational support. With the growth in popularity for options trading and the increased percentage of retail traders options trading volume, 2025’s number of Americans who actively trade options is most likely closer to 15 million. This is supported by the fact that in 2023, retail traders contributed to over 40% of daily U.S. equity trading volume, which was approximately 45 million contracts traded with a notional value of $2.1 trillion (Acworth, 2024; Mackintosh, 2023).
Serviceable Obtainable Market (SOM)
The Serviceable Obtainable Market (SOM) is the portion of the SAM that SmartOptions can realistically capture in the short-to-medium term, given competition, resources, and marketing efforts. Given 11 million total SAM growing 10% annually, the total U.S. retail options market is expected to reach 16.1 million by 2030 and 21 million by 2033. Assuming initially low but increasingly ascending market share assumptions from .5% in 2026 to 8% in 2030 to 16% in 2033 (outlined in table), SmartOptions user base is expected to grow from 55,000 in 2026 to 1.2 million in 2030 and to 3.4 million users in 2035.
Table 4 : SmartOptions User Growth
| Year | U.S. Retail Options Market | Annual Growth | Market Share | Users |
| 2026 | 11,000,000 | 10.0% | 0.5% | 55,000 |
| 2027 | 12,100,000 | 10.0% | 1.0% | 121,000 |
| 2028 | 13,310,000 | 10.0% | 2.0% | 266,200 |
| 2029 | 14,641,000 | 10.0% | 5.0% | 732,050 |
| 2030 | 16,105,100 | 10.0% | 8.0% | 1,288,408 |
| 2031 | 17,715,610 | 10.0% | 11.0% | 1,948,717 |
| 2032 | 19,487,171 | 10.0% | 14.0% | 2,728,204 |
| 2033 | 21,435,888 | 10.0% | 16.0% | 3,429,742 |
Note. From SmartOptions – conducted April 2025 by the SmartOptions Research Team
FIGURE 15: SmartOptions’ User Growth
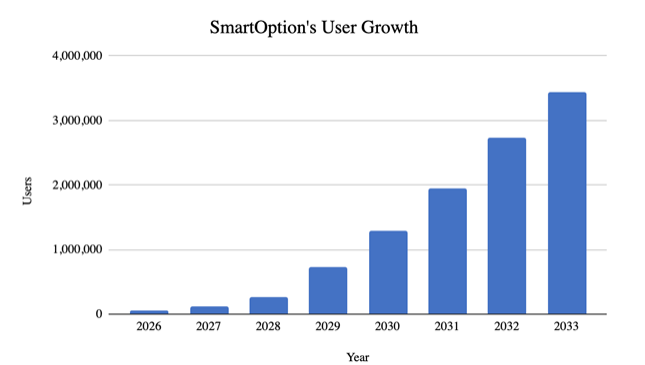
Note: From SmartOptions Market Analysis, conducted April 2025 by the SmartOptions research team.
Business Model
SmartOptions is designed to be a mission-driven, scalable platform that aligns its financial success directly with user success. The business model is centered on improving the quality of options trade execution for retail investors, solving a major inefficiency in today’s fragmented and predatory trading environment. Unlike traditional brokerages that profit from order volume or hidden transaction fees, SmartOptions generates revenue only when it creates tangible savings or value for users. The business model consists of two tightly integrated revenue streams: (1) performance-based spread capture and (2) tiered freemium subscriptions.
Performance-Based Spread Capture
The primary driver of revenue for SmartOptions is SmartEngine, an AI-powered execution optimizer that identifies better-priced trading opportunities across brokerages. When SmartEngine successfully compresses a user’s bid-ask spread, SmartOptions collects 20% of the realized savings as a performance fee.
How It Works:
- A user initiates an options trade with a typical market spread of 12%.
- SmartEngine scans across brokerage quotes and compresses the spread down to 4%.
- On a $400 notional trade, SmartOptions captures $5.80, which is 20% of a total $29 spread capture, while the user retains $23.2 in savings.
- For a retail trader placing 100 trades per year, SmartOptions captures $580 in spread savings, resulting in $2,320 in net annual savings for the user after SmartEngine fees.
Assuming 10% annual growth in both average savings per user and spread revenue captured, SmartOptions will achieve nearly $200 million in revenue by 2028, $1 billion in revenue by 2030, and $3.8 billion in revenue by 2033.
Table 5: SmartOptions Spread Capture Revenue
| Year | Active Users | Average Savings/User | Spread Revenue/User (20% capture) | Total Spread Capture Revenue (M) |
| 2026 | 55,000 | $2,320 | $580 | $31.9M |
| 2027 | 121,000 | $2,552 | $638 | $77.3M |
| 2028 | 266,200 | $2,807 | $702 | $186.8M |
| 2029 | 732,050 | $3,087 | $772 | $565.4M |
| 2030 | 1,288,408 | $3,396 | $849 | $1,094.4M |
| 2031 | 1,948,717 | $3,736 | $934 | $1,818.1M |
| 2032 | 2,728,204 | $4,109 | $1,027 | $2,800.9M |
| 2033 | 3,429,742 | $4,520 | $1,130 | $3,878.6M |
Note. From SmartOptions – conducted April 2025 by the SmartOptions Research Team
Unlike legacy platforms that profit from user trading volume, SmartOptions only succeeds when users become smarter and more profitable. Its model aligns incentives by earning revenue through user savings, fostering trust and loyalty. By transparently demonstrating savings instead of relying on hidden spreads, SmartOptions builds defensible credibility. This approach also enables scalable, high-margin growth without proportional cost increases.
Tiered Freemium Subscription
To complement its performance fee model and enhance user lifetime value, SmartOptions offers a tiered subscription service tailored to various levels of trader sophistication. By supporting both free and paid tiers, SmartOptions ensures that value is accessible to beginners while still offering compelling premium upgrades for more engaged users. This tiered model provides important strategic advantages:
- Seamless User Acquisition: Offering basic services for free reduces onboarding barriers and rapidly expands the user base.
- Predictable Recurring Revenue: Paid subscriptions create a stable, recurring revenue stream independent of market volatility.
- Upsell Pathway: As users experience success with basic tools, they are naturally incentivized to upgrade for advanced predictive analytics, increasing customer lifetime value.
Subscription revenue will be divided into three tiers: Free, Premium, and Pro. Based on competitor data, SmartOptions recommends pricing its Premium tier at $20 per month, significantly below the industry median of approximately $49/month ensuring affordability for retail traders. The Pro tier is set at $45 per month, offering enhanced value while remaining accessible compared to significantly higher-priced competitors.
Table 6: SmartOptions Subscription Packages
| Tier | Price | Key Features |
| Free Tier | $0/month | – SmartEngine Lite
– Basic Option Stock Screener (limited filters) – Basic Market Trade Setup Analysis – Trade Replays (limited number) – EOD Alert Recommendations – Cone of Accuracy (no live updates) |
| Premium Tier | $20/month | – SmartEngine Premium
– Full Option Stock Screener (all filters + ML stock ideas) – Full Market Trade Setup analysis – Trade replays (no limit) – Real-Time Alert Recommendations – Cone of Accuracy (live and dynamic updates) |
| Pro Tier | $45/month | – SmartEngine Pro Suite
– Automated Trading for predefined strategies – Trade Replays with Post-Trade Coaching – Risk Management Alerts (threshold warnings) – Dynamic hedging alerts – Portfolio Evaluation and Personalized Risk Reports |
Note. From SmartOptions – conducted April 2025 by the SmartOptions Research Team
Assuming 15% premium users and 10% pro users growing 1% annually, SmartOptions will earn $28 million in total subscription revenue by 2028, $156 million in revenue by 2030, and nearly $500 million in revenue by 2033.
Table 7: SmartOptions Subscription Revenue
| Year | Active Users | Premium Users | Pro Users | Premium Revenue ($20/mo) (M) | Pro Revenue ($45/mo) (M) | Total Subscription Revenue (M) |
| 2026 | 55,000 | 8,250 (15%) | 5,500 (10%) | $2.0M | $3.0M | $5.0M |
| 2027 | 121,000 | 19,360 (16%) | 13,310 (11%) | $4.6M | $7.2M | $11.8M |
| 2028 | 266,200 | 45,254 (17%) | 31,944 (12%) | $10.9M | $17.2M | $28.1M |
| 2029 | 732,050 | 131,769 (18%) | 95,166 (13%) | $31.6M | $51.4M | $83.0M |
| 2030 | 1,288,408 | 244,797 (19%) | 180,377 (14%) | $58.8M | $97.4M | $156.2M |
| 2031 | 1,948,717 | 389,743 (20%) | 292,307 (15%) | $93.5M | $157.8M | $251.3M |
| 2032 | 2,728,204 | 572,922 (21%) | 436,512 (16%) | $137.5M | $235.7M | $373.2M |
| 2033 | 3,429,742 | 754,543 (22%) | 583,056 (17%) | $181.1M | $314.9M | $496.0M |
Note. From SmartOptions – conducted April 2025 by the SmartOptions Research Team
SmartOptions’ two main revenue streams, performance-based spread capture and tiered subscriptions, position it for strong financial growth, even under conservative assumptions. Expansion is fueled by both a growing user base and increasing engagement per user. Even with modest subscription adoption and gradual spread improvement across users, SmartOptions projects approaching $215 million in revenue by 2028, $1.25 billion in annual revenue by 2030 and $4.3 billion in annual revenue by 2033. Growth is driven by both expanding user count and deepening engagement per user.
Table 8: SmartOptions Total Revenue
| Year | Active Users | Total Subscription Revenue (M) | Total Spread Capture Revenue (M) | Total Revenue (M) |
| 2026 | 55,000 | $5.0M | $31.9M | $36.9M |
| 2027 | 121,000 | $11.8M | $77.3M | $89.1M |
| 2028 | 266,200 | $28.1M | $186.8M | $214.9M |
| 2029 | 732,050 | $83.0M | $565.4M | $648.4M |
| 2030 | 1,288,408 | $156.2M | $1,094.4M | $1,250.6M |
| 2031 | 1,948,717 | $251.3M | $1,818.1M | $2,069.4M |
| 2032 | 2,728,204 | $373.2M | $2,800.9M | $3,174.1M |
| 2033 | 3,429,742 | $496.0M | $3,878.6M | $4,374.6M |
Note. From SmartOptions – conducted April 2025 by the SmartOptions Research Team
FIGURE 16: SmartOptions’ Total Revenue
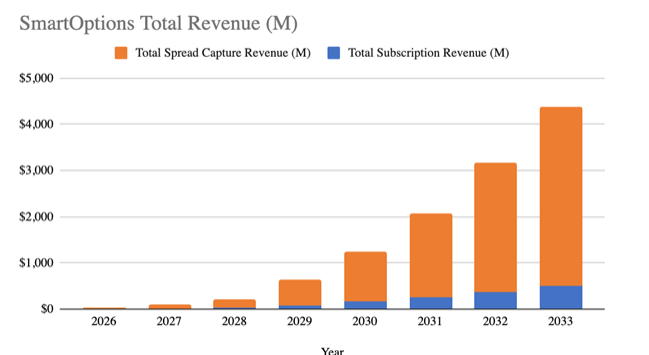
Note. From SmartOptions – conducted April 2025 by the SmartOptions Research Team
Other Revenue Streams
In addition to subscription and spread capture revenue, SmartOptions has multiple scalable revenue streams opportunities designed to enhance profitability and align with user outcomes:
- Digital Advertising: SmartOptions will generate revenue from traditional digital advertising placements within the user interface, carefully designed to capture trader interest in a non-intrusive and contextually relevant way.
- Performance-Based Trade Fees: The platform will collect small performance-based fees on profitable trades, either as a flat fee or a percentage fee of up to 0.2%. This model closely aligns SmartOptions’s incentives with user success, in contrast to traditional volume-driven or pay-for-order-flow models.
- Enterprise and API Licensing: SmartOptions offers white-label partnerships and API access for broker-dealers, financial advisors, educational platforms, and institutional clients. Licensing agreements will combine fixed annual charges with usage-based components, enabling seamless integration into trading platforms and unlocking additional B2B revenue opportunities.
- Options Trading Robo-Advisory: SmartOptions will launch a robo-advisory service that automates trade selection, portfolio rebalancing, and risk management based on user risk profiles, using strategies like covered calls, spreads, and hedges. Clients pay a 0.25%–1% management fee for passive exposure to structured options strategies.
→ Continue to Part 4: MVP Prototype & Product Demo