Principles are easy – execution is hard.
Parts 1 and 2 covered the foundation: the implementation roadmap, business agility, Lean-Agile thinking, and the ten principles that hold the whole thing together. Important stuff, but none of it matters if you can’t actually ship.
This is where SAFe earns its reputation for complexity – PI Planning, the Continuous Delivery Pipeline, Portfolio Kanban, WSJF. The alphabet soup gets thick, but once you see how the pieces connect, it’s not that complicated. It’s just thorough.
We’re going to walk through exactly how work flows from strategy to delivery: how Business Owners stay plugged in without micromanaging, how Product Managers and Product Owners split responsibilities, how Design Thinking keeps teams from building things nobody wants, and how the requirements hierarchy actually functions in practice.
Let’s get into it.
Business Owners
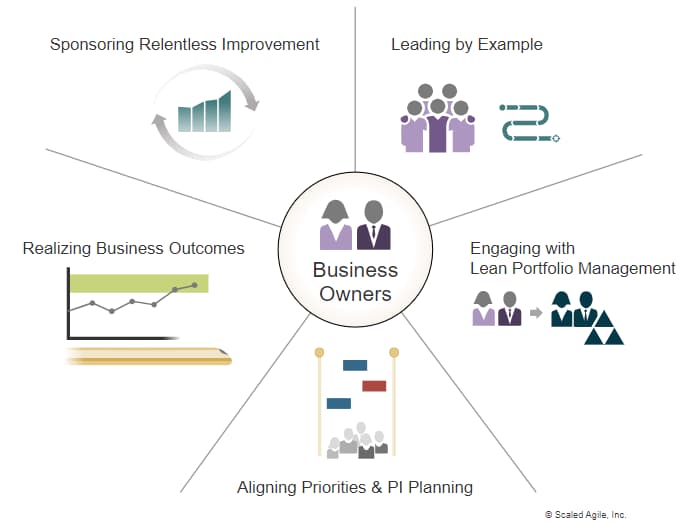
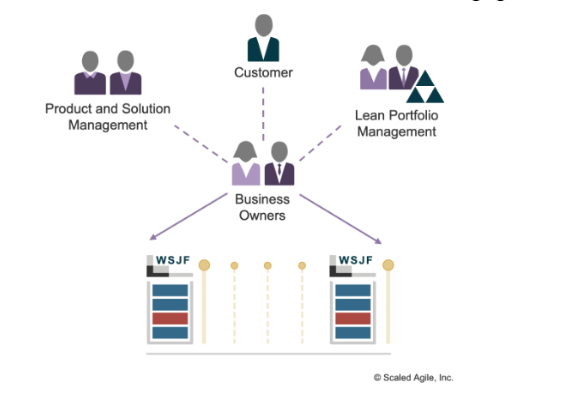
Business Owners (BOs) are key ART stakeholders who have the primary business and technical responsibility for return on investment (ROI), governance, and compliance. They’re not passive observers – they’re active participants who ensure the ART delivers real business value.
Who Are Business Owners?
Business Owners typically include general or line of business managers, Product or Solution Managers, Enterprise Architects, C-level executives, operations executives, senior engineering leaders, and customers (for bespoke solutions).
Leading By Example
Business Owners set the tone for the transformation. They serve as an example of new behaviors, communicate the vision for SAFe adoption, actively engage with the Lean-Agile Center of Excellence (LACE), address the concerns of people who resist the change, and act as change agents.
Engaging with Lean Portfolio Management
Business Owners participate in key LPM activities including strategy and investment funding, agile portfolio operations, lean governance, serving occasionally as Epic Owners, and participatory budgeting.
This is a frequently tested concept: The continuous involvement of Business Owners during the PI serves as a critical Guardrail for the ART’s budgetary spending.
Aligning Priorities and PI Planning
Business Owners are responsible for understanding and refining the Strategic Themes that influence ARTs. They have knowledge of the current Enterprise, Portfolio, and Value Stream context. They’re involved in driving or reviewing the solution vision and Roadmap. Their continuous involvement during the PI serves as a critical Guardrail for the ART’s budgetary spending.
When aligning priorities, Business Owners provide input to backlog refinement, ensure that business objectives are understood, and prepare to communicate the business context.
During PI Planning, Business Owners present the business context and vision, engage during critical ART PI Planning activities, review draft and final plans, watch for external commitments and dependencies, participate in management review and problem-solving, participate in solution train planning, and assign business value to PI Objectives.
This last responsibility is critical and frequently tested: Business Owners assign business value to team PI Objectives. This business value scoring becomes essential for calculating predictability measures and ensuring teams focus on what matters most to the business.
Realizing Business Outcomes
Business Owners stay engaged throughout the PI. They maintain alignment, help validate the definition of MVPs, attend the System and Solution Demos, attend Agile team events, actively address impediments, and participate in Release Management.
Sponsoring Relentless Improvement
Business Owners create the environment for continuous improvement. They continually focus on eliminating waste and delays, eliminate demotivating policies and procedures, inspire and motivate others, create a generative culture that highly values relentless improvement, provide the time and space for teams to innovate, and help drive investment in the continuous delivery pipeline.
Customer Centricity and Design Thinking
Customer centricity is a mindset focused on customer behaviors that produce the best innovations. It’s not just about asking customers what they want—it’s about deeply understanding their needs, often before they can articulate them.
A customer-centric mindset involves focusing on the customer, understanding the customer’s needs, thinking and feeling like the customer, building whole product solutions, and knowing customer lifetime value.
Driving Research: Market vs. User Research
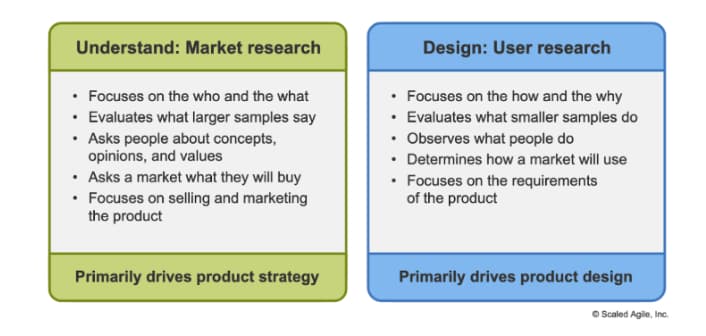
Market research and user research explore different aspects of the problem and solution space.
Market Research (Understand) focuses on the who and the what. It evaluates what larger samples say, asks people about concepts, opinions, and values, asks a market what they will buy, focuses on selling and marketing the product, and primarily drives product strategy.
User Research (Design) focuses on the how and the why. It evaluates what smaller samples do, observes what people do, determines how a market will use the product, focuses on the requirements of the product, and primarily drives product design.
Designing with Empathy
Gemba Walks—going to the customer’s workplace—is a powerful technique for understanding how customers actually work, not how you think they work. Observe customers in their natural environment to discover pain points, workarounds, and unmet needs.
For General Solutions, customer interaction is often based on requirements workshops, focus groups, usability testing, and limited beta releases. The solution evolves through feedback from user behavior analysis, metrics, and business intelligence to validate various hypotheses.
For Custom-Built Solutions, customers are often directly involved throughout the development process, with more continuous feedback loops.
Whole Product Thinking
Customers don’t buy features — they buy complete solutions to their problems. Whole product thinking recognizes that a successful product must address multiple layers of customer needs.
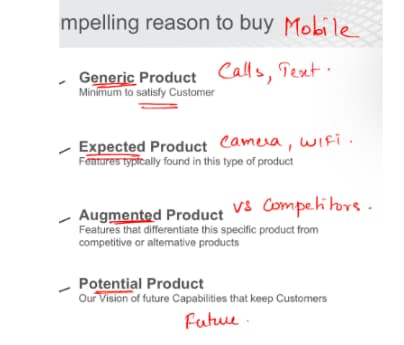
The MVP is the minimal version that’s an actual product — not just a prototype, but a real, shippable product with just enough features to validate learning. The Core Product addresses basic functional needs. The Expected Product provides attributes buyers assume will be there — table stakes. The Augmented Product differentiates from competitors to delight customers. The Potential Product envisions features necessary to attract and retain customers indefinitely (frequently tested concept).
Leveraging Market Rhythms and Events
The value of a product to customers and the organization can vary significantly based on the timing of the release.
A Market Rhythm is a set of events repeatedly occurring on a predictable cadence (e.g., back-to-school season, tax season, holiday shopping).
A Market Event is a one-time future event with a high probability of materially affecting one or more solutions (e.g., regulatory change, competitor launch, trade show).
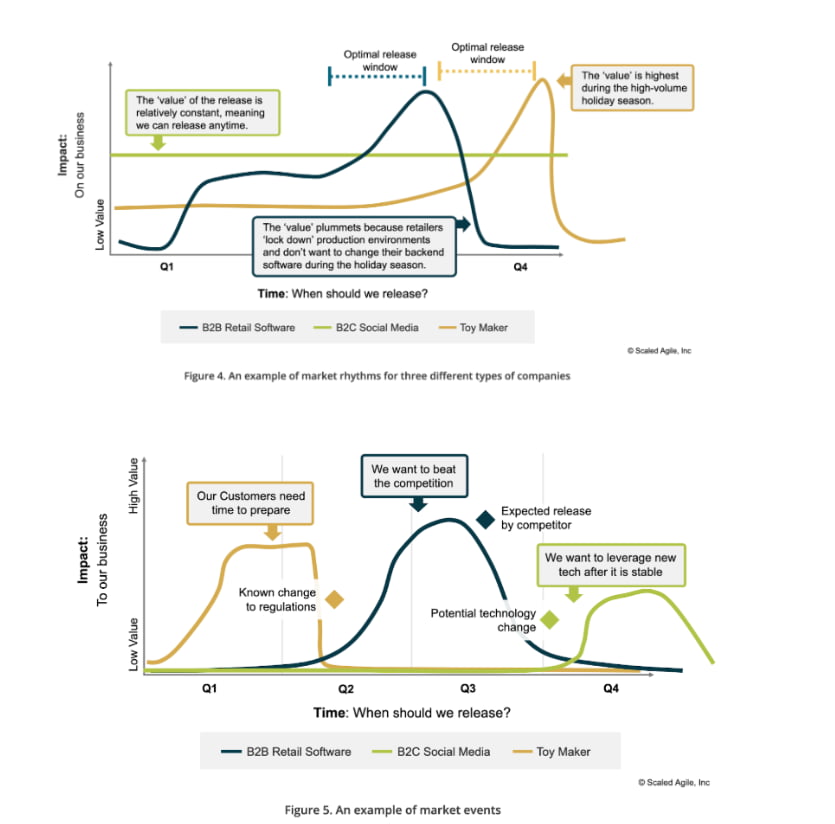
Understanding these rhythms and events helps Product Management time releases for maximum impact. Releasing retail software right before Black Friday might be disastrous, while releasing a consumer app at the same time could be perfect.
Understanding Customer Value
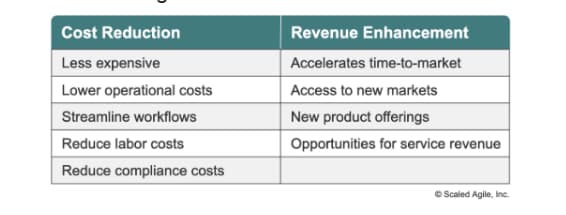
Customer value comes in two primary forms: reducing costs and enhancing revenue. Understanding which matters most to your customer shapes how you position and build your solution.
Design Thinking
Design thinking represents a profoundly different approach to product and solution development, in which divergent and convergent techniques are applied to understand a problem, design a solution, and deliver that solution to the market.
This is a frequently tested concept: Design thinking alternates between divergent thinking (understanding and exploring options) and convergent thinking (evaluating options and making choices).
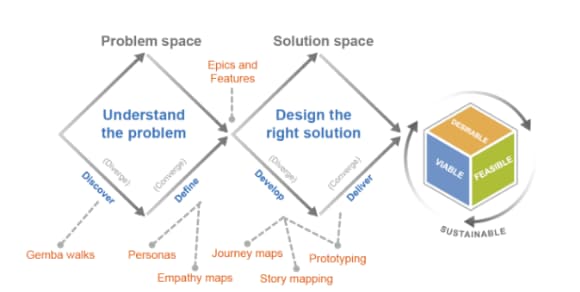
The Four Activities of Design Thinking
Discover focuses on how users work, not how they should work. This involves observing actual behavior in context, conducting Gemba walks, and gathering qualitative insights.
Define results include personas and empathy maps. This phase synthesizes research findings, defines the problem clearly, and creates shared understanding.
Develop involves journey and story mapping along with prototyping. Teams explore multiple solution approaches, test assumptions quickly, and iterate based on feedback.
Deliver produces artifacts suitable for creating the solution. This phase transitions from design to development while maintaining design fidelity through implementation.
Measuring Design Efforts
Every design effort should be evaluated against four criteria:
Desirable: Do customers want it? Feasible: Can we deliver it? Viable: More value than cost and profitable? Sustainable: Managed for its expected product lifecycle?
All four must be true for a solution to succeed. A desirable and feasible solution that isn’t viable won’t get funded. A viable solution that isn’t sustainable will create technical debt and maintenance nightmares.
Customer Journey Maps
A customer journey map illustrates the experience as a user engages with a company’s Operational Value Stream, products, and services. Journey maps are powerful design thinking tools for operational value streams (frequently tested).
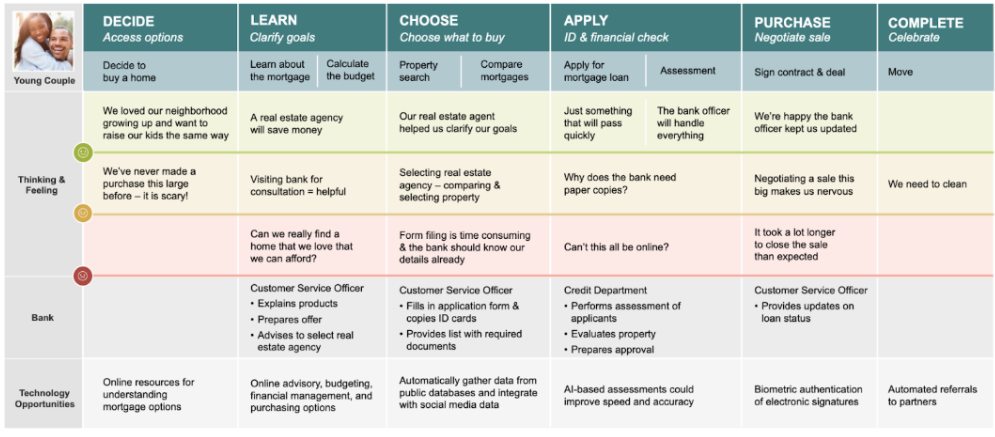
Journey maps reveal not just what customers do, but how they feel at each stage. The emotional journey matters as much as the functional journey.
User Personas and Empathy Maps
Personas are fictional consumers derived from customer research. They depict different people who might use a product in a similar way, providing insights into how real users would engage with a solution (frequently tested).
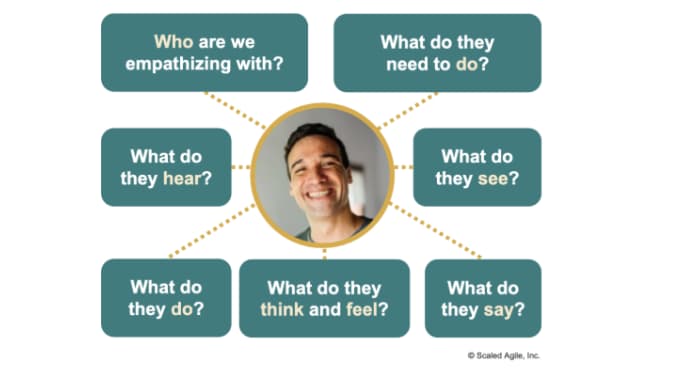
Empathy maps help teams build deeper understanding by exploring what customers see, hear, say, do, think, and feel.
Story Mapping
Story maps organize a sequence of stories according to tasks a user needs to accomplish their goal. They help teams ideate, plan, and group activities in a workflow, addressing the most critical steps before improving existing ones or adding new functionality.
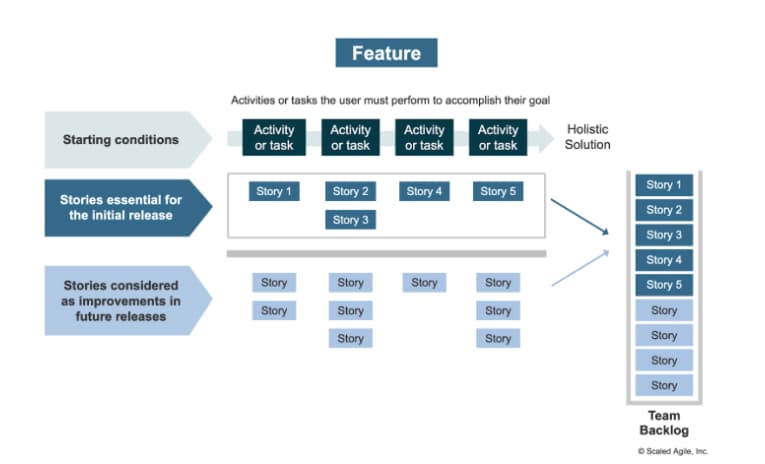
Story maps are an important design thinking tool that enables Customer Centricity because they focus on delighting a user instead of merely implementing stories ordered by their value. Another benefit is avoiding releasing a feature (or solution) that is not usable because its functionality depends on stories that are lower in priority and further down the backlog.
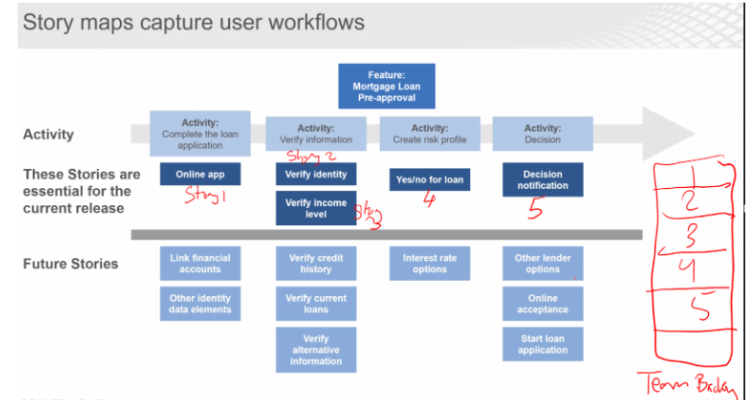
Steps to create a story map: Frame the purpose, map the whole story, brainstorm, identify the stories essential for the initial release, identify stories considered as improvements in future releases.
Story maps organize horizontally by workflow and vertically by priority, creating a two-dimensional view that’s more intuitive than a linear backlog.
Benefit-Feature Matrix
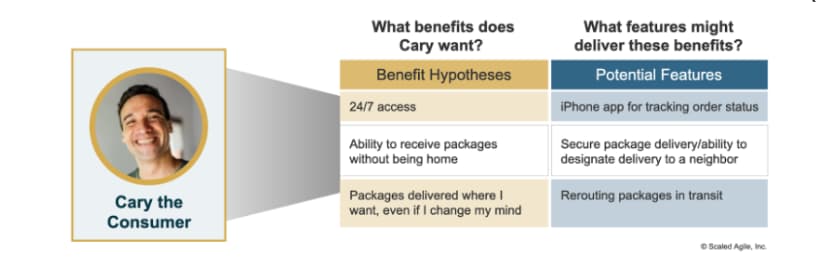
Design thinking promotes switching the order of the traditional feature-advantage-benefit (FAB) presentation to a benefit-feature matrix. Start with what the customer wants (benefits), then identify features that deliver those benefits. This keeps teams focused on outcomes rather than outputs.
Increasing Design Feedback Through Prototypes
Prototypes are one of the most powerful tools for getting fast feedback and reducing risk.
Benefits of prototyping include fast feedback, risk reduction, intellectual property/patent filing, and models for requirements.
Note: Lower cost is NOT a benefit of prototypes (frequently tested). Prototypes cost time and money to build. Their value is in learning, not saving money.
Types of prototypes:
- Paper prototypes are handwritten sketches for quick ideation.
- Mid-Fi prototypes are visually complete representations but not functionally integrated (e.g., clickable mockups).
- Hi-Fi prototypes are visually complete and interactive that the customer can explore (looks and feels like the real thing).
- Hardware prototypes provide feedback on form factors, sizes, and operational requirements.
Empathic Design
Empathetic design is a set of techniques designed to gain information that is not accessible through other observation-oriented market research methods. What sets empathetic design apart from traditional market research methods is that it is based on observation in the customer’s own environment.
Rather than asking customers what they want, empathic design observes what they do, uncovering needs they may not even realize they have.
DevOps
DevOps is a mindset, culture, and set of technical practices that supports the integration, automation, and collaboration needed to effectively develop and operate a solution. The goal is simple—deliver value whenever there is a business need.
This is frequently tested: DevOps is a mindset, culture, and set of technical practices—it’s not just about tools or automation.
DevSecOps is a term that emphasizes the importance of proper information security practices in the pursuit of continuous delivery. It is another way to say DevOps—security isn’t an afterthought, it’s built in from the start.
What DevOps Is and Isn’t
DevOps is NOT about large batches, siloed teams, handoffs, monolithic architectures, change review boards, politics, or heroics.
DevOps IS about shared values, cross-functional collaboration, objective measurements, automation, and modern technical practices.
DevOps Myths and Facts (Frequently Tested)
“DevOps is just about automation” — MYTH. Automation is important, but DevOps is fundamentally about cultural change.
“DevOps is about cultural change” — FACT. Without changing how teams collaborate and share responsibility, tools and automation won’t deliver value.
“You don’t need Lean-Agile to have a successful DevOps implementation” — MYTH. DevOps and Lean-Agile principles are complementary and mutually reinforcing.
“Agile is for development, not operations” — MYTH. Agile principles apply to all knowledge work, including operations.
“The deployment pipeline is used to deploy environments as well as solutions” — FACT. Infrastructure as Code means environments are versioned and deployed just like software.
“DevOps tries to bridge the gap between new features and stable solutions” — FACT. This is the core tension DevOps addresses: speed vs. stability.
“Measurements are an important part of DevOps” — FACT. You can’t improve what you don’t measure.
“Automation of Testing reduces holding cost” — MYTH. Automation reduces transaction cost (the cost of executing tests), which enables smaller batches and reduces holding cost (the cost of work waiting).
“DevOps is only for small software companies” — MYTH. Large enterprises benefit even more from DevOps practices.
“Chaos Monkey was developed by Netflix” — FACT. Netflix pioneered chaos engineering to build resilient systems.
CALMR: The Five Dimensions of DevOps
This is frequently tested: CALMR stands for Culture, Automation, Lean Flow, Measurement, and Recovery.
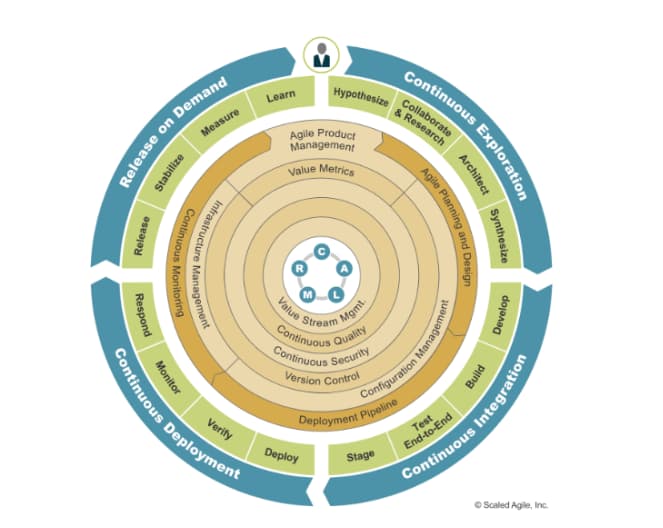
- Culture: Build a collaborative culture between development and operations.
- Automation: Automate the continuous delivery pipeline.
- Lean Flow: Keep batch sizes small and optimize the whole system.
- Measurement: Measure the flow through the pipeline and the stability of production.
- Recovery: Architect for low-risk releases and fast recovery.
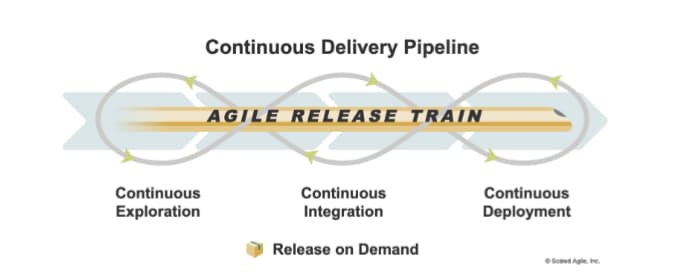
The Continuous Delivery Pipeline
The Continuous Delivery Pipeline (CDP) represents the workflows, activities, and automation needed to deliver new functionality more frequently.
DevOps helps break down organizational silos and develop a Continuous Delivery Pipeline.
The Continuous Delivery Pipeline has four elements: Continuous Exploration, Continuous Integration, Continuous Deployment, and Release on Demand.
Continuous Exploration
Continuous Exploration (CE) is the ongoing process of exploring the market and user needs, defining a vision, roadmap, and set of features to address those needs.
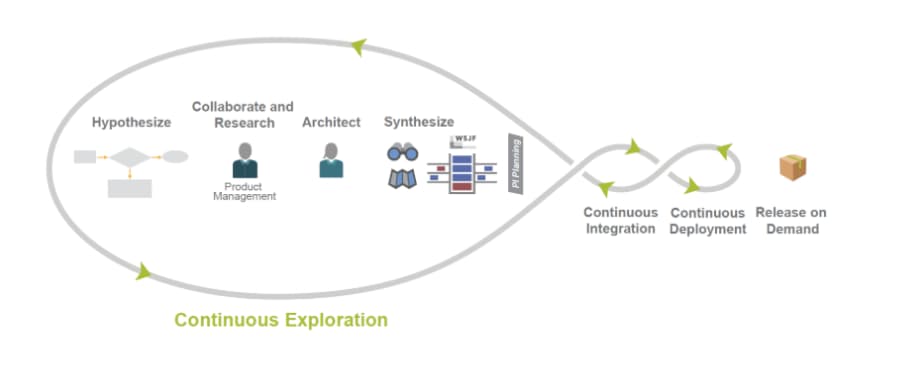
Continuous Exploration activities include exploring market and customer needs, defining a vision and roadmap, creating and refining the backlog, and establishing architectural runway.
This is where Product Management spends most of their time—understanding what should be built and why.
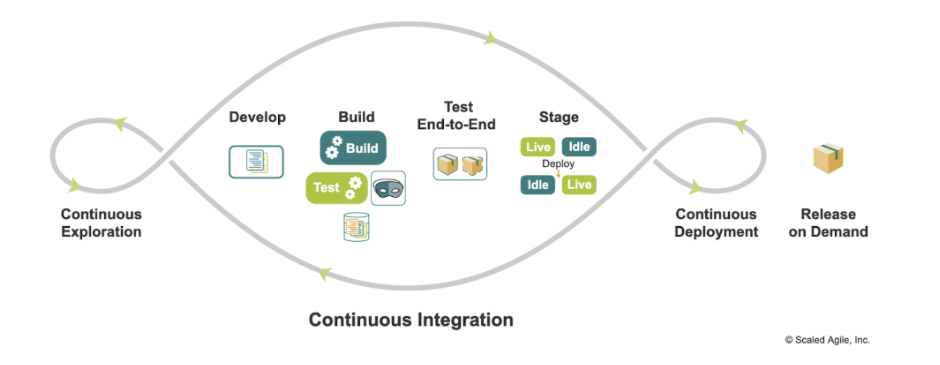
Continuous Integration
Continuous Integration focuses on taking features from the Program (ART) Backlog and implementing them.
Benefits of Continuous Integration
Continuous Integration improves quality, reduces risk, and establishes a fast, reliable, and sustainable development pace. With continuous integration, the system always runs, meaning it’s potentially deployable, even during development (frequently tested). Iterations are time-boxed events. Functionality is demonstrated throughout and can be released at any time as market needs warrant.
The Four Activities of Continuous Integration
1. Develop
Teams decompose Features into Stories during PI Planning and Iteration Planning. Stories are small enough to complete within an iteration.
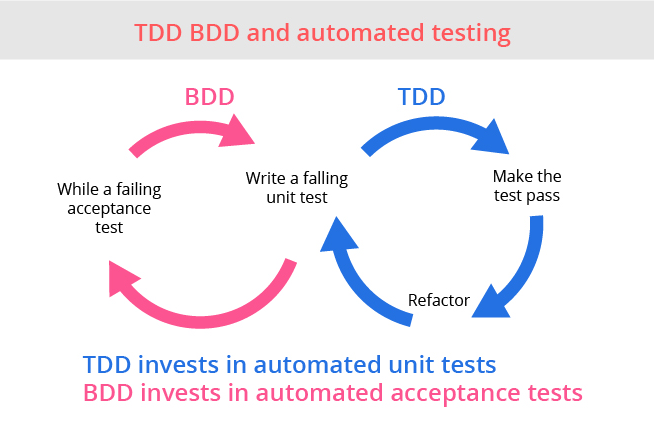
Behavioral-Driven Development (BDD) is a process Product Owners and teams use to understand requirements better and improve quality by creating acceptance criteria and automating tests, often before the code is written. Tests are written to describe the behavior of the software from the user’s perspective. BDD Testing uses Given-When-Then syntax for acceptance criteria.
Test-Driven Development (TDD) involves writing the unit test first, then building the minimal code needed to pass the test. This testing technique leads to better design, higher quality, and increased productivity. Tests are written before any code is written. The developer writes a test case that fails and then writes the minimum amount of code required to pass that test case. Instead of performing most of the testing at the end, Agile teams define and execute many tests early and often as a part of their integration process.
Version Control enables quick recovery from problems and improves quality, ensuring the integration of the right components. All code and configuration should be in version control.
Built-in Quality prescribes practices around flow, architecture and design quality, code quality, system quality, and release quality. Practices include shifting learning left (find problems early), pairing and peer reviews, collective ownership and T-shaped skills, artifact standards and Definition of Done, and workflow automation.
Application Telemetry is the primary mechanism that acquires and then uses application data to help determine the results of relevant hypotheses. Instrumentation should be built into the application from the start.
Threat Modeling ensures system design identifies possible vulnerabilities that teams may introduce with new functionality. Security must be considered from the beginning, not bolted on at the end.
2. Build
Continuous Code Integration means code commit should automatically trigger the compilation and testing of changes. Addressing a broken build should be the highest priority. If the build breaks, stop and fix it immediately.
Build and Test Automation involves automating the build and test tools to run upon code commit. This is one of the best ways to integrate and includes unit- and story-level tests.
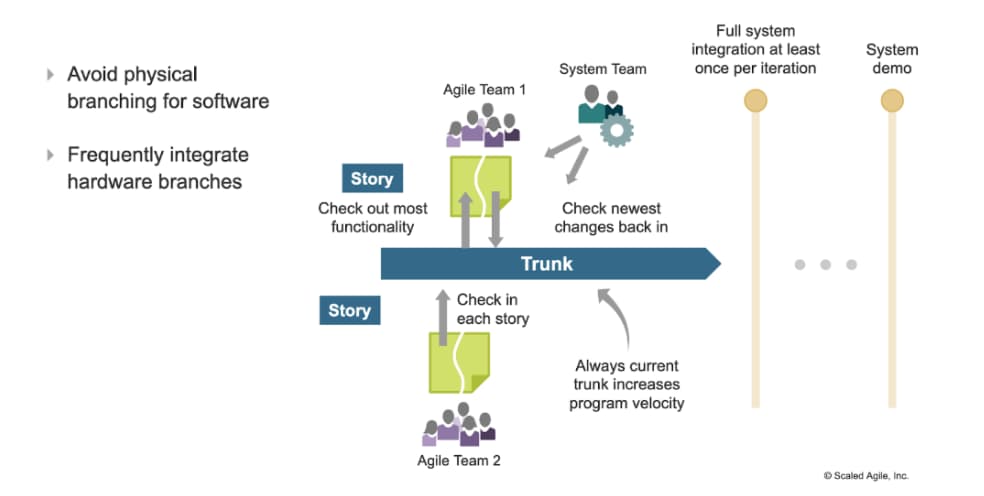
Trunk-Based Development means integrating code quickly, at least once daily. All teams should work off a single trunk, avoiding long-lived branches. Long-lived branches lead to painful merges and delayed integration.
Gated Commit ensures software has passed the gate (e.g., unit tested, performance-tested, free of known defects) before being checked into the main codebase or trunk.
Application Security means code analysis tools inspect the code and third-party packages for known vulnerabilities. Security scanning should be automated and run on every build.
3. Test End-to-End
Five practices can help improve end-to-end system testing:
Test and Production Environment Congruity assures that testing exercises the solution as it would behave in front of live users and decreases the probability that defects will escape into production. The staging environment should closely resemble production.
Test Automation should include a variety of tests, such as functional, integration, regression, and more. The goal is to automate everything that can be reasonably automated.
Test Data Management ensures realistic test data that respects privacy and security requirements is essential for meaningful testing.
Service Virtualization allows teams to simulate a production environment without the costs and effort associated with creating and managing physical infrastructure. When you depend on external services, simulate them to enable testing.
Testing Nonfunctional Requirements (NFRs) ensures system attributes such as security, reliability, performance, scalability, and usability are tested. Don’t wait until the end to test performance or security.
Continuous Integration with Suppliers means when you depend on external suppliers, integrate frequently with them as well.
4. Stage
Maintain a Staging Environment that closely resembles production in configuration, data, and infrastructure.
Blue/Green Deployment involves two environments—live (production) and idle (staging). Changes flow continuously to idle, are staged, and readied for production deployment. When ready, a configuration change switches the two environments. Idle becomes live, while the old live becomes the new idle. This approach enables continuous delivery, zero-downtime deployment, and fast failure recovery.
The System Demo typically happens every 2 weeks, at the end of the iteration (frequently tested). The system demo is typically demoed from the Staging environment which closely resembles Production. This is where teams demonstrate integrated functionality to stakeholders and get feedback.
Decoupling Release Elements from Total Solution
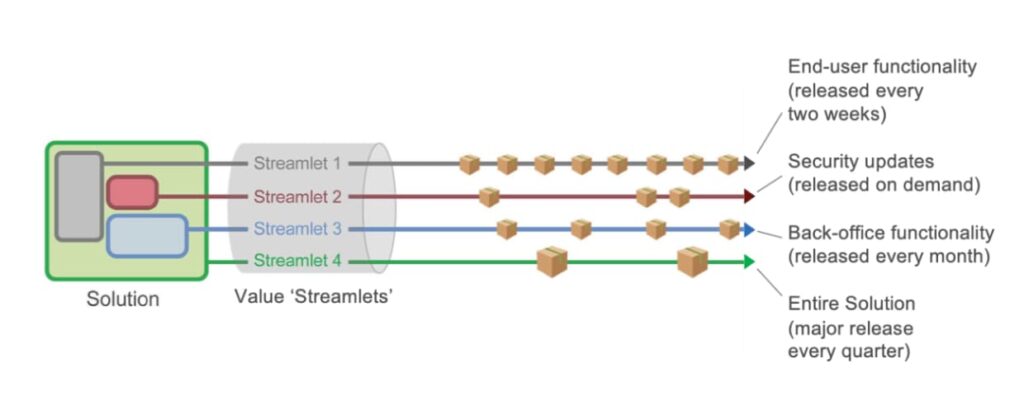
Diagram showing Solution with 4 Value Streamlets
Different parts of a solution can be released on different cadences. Security updates might be released on demand, while major new features follow a quarterly cadence. This separation of deployment from release is a key DevOps practice.
Enabling a Culture of Continuous Integration
Teams iterate frequently, make integration results visible, fix failed integrations as top priority, establish a shared cadence, develop and maintain proper infrastructure, and apply supportive software engineering practices.
Continuous Deployment
Continuous Deployment takes the validated system increment from staging and deploys it to production—though not necessarily released to end users yet.
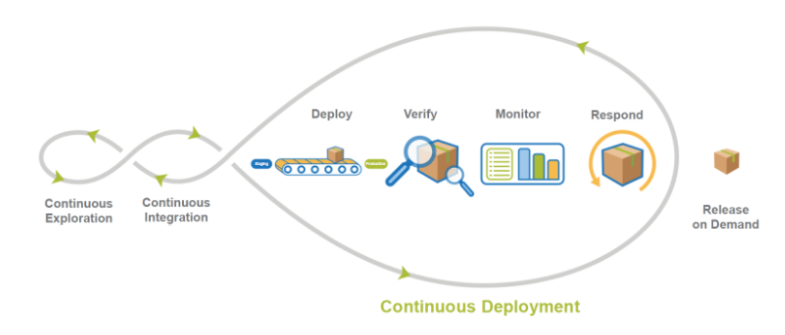
The four activities of Continuous Deployment are Deploy (move the validated build to production), Verify (confirm the deployment was successful), Monitor (watch system behavior in production), and Respond (react to issues quickly).
Release on Demand
Through Release on Demand, value can be made available to customers all at once or staggered based on market and business needs (frequently tested).
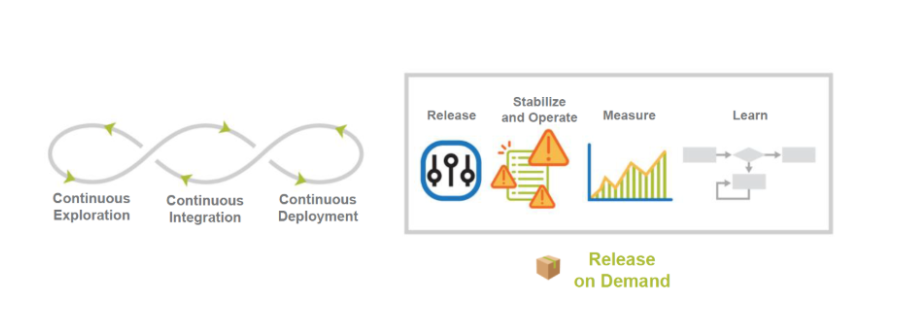
Separate deployment from release by hiding new functionality under feature toggles. This enables testing in production before users see it. Deploy continuously, release strategically.
DevOps enables all four Release on Demand activities with different combinations of technical practices and tooling (frequently tested).
As a PO, will you release all stories to production when the sprint is done? No — they need more testing and environments. Can you release two stories mid-sprint? Yes — if they’re ready and the business wants them.
This separation is powerful. Deploy frequently (even multiple times daily) while releasing on a schedule that makes business sense.
Solution Demo
A ‘solution’ is intentionally general, defined as a product, system, or service that provides value to internal or external customers.
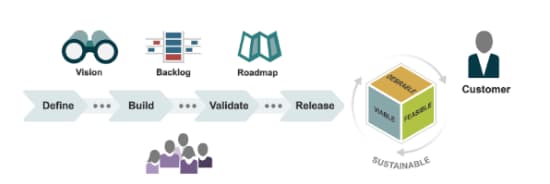
Solution’s Four Fundamental Properties
Every solution must be Desirable (do customers want it?), Feasible (can we build it?), Viable (is it economically sustainable?), and Sustainable (can we maintain it over its lifecycle?).
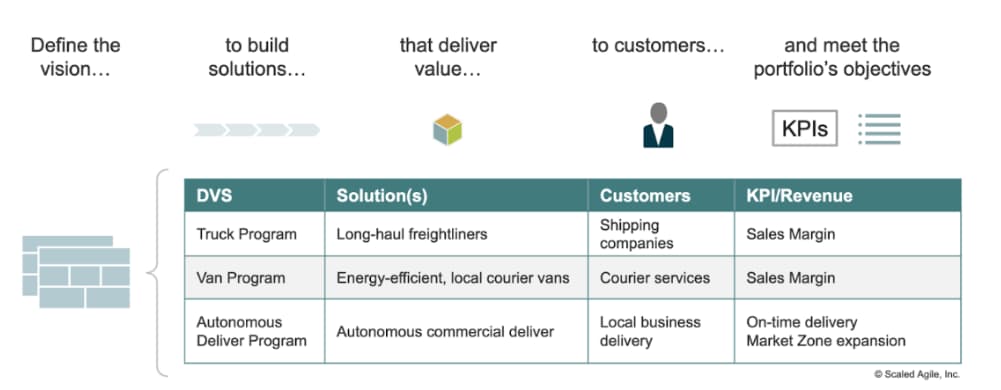
The Portfolio Canvas connects strategy to execution and shows how solutions will deliver the portfolio’s value and realize its objectives.
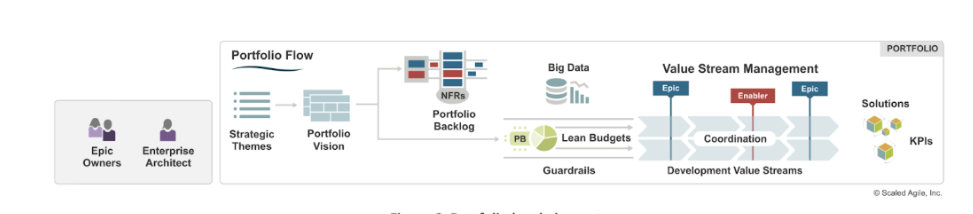
Portfolio SAFe
A SAFe portfolio is organized around value, and it is a collection of development value streams.
Value Streams
Operational Value Streams contain the steps and the people who deliver end-user value using solutions created by the development value streams.
Development Value Streams contain the steps and the people who develop solutions used by operational value streams.
This is frequently tested: The value stream construct in SAFe replaces the need to organize people around projects. Instead of temporary project teams, you have persistent value stream organizations.
Value Stream Canvas
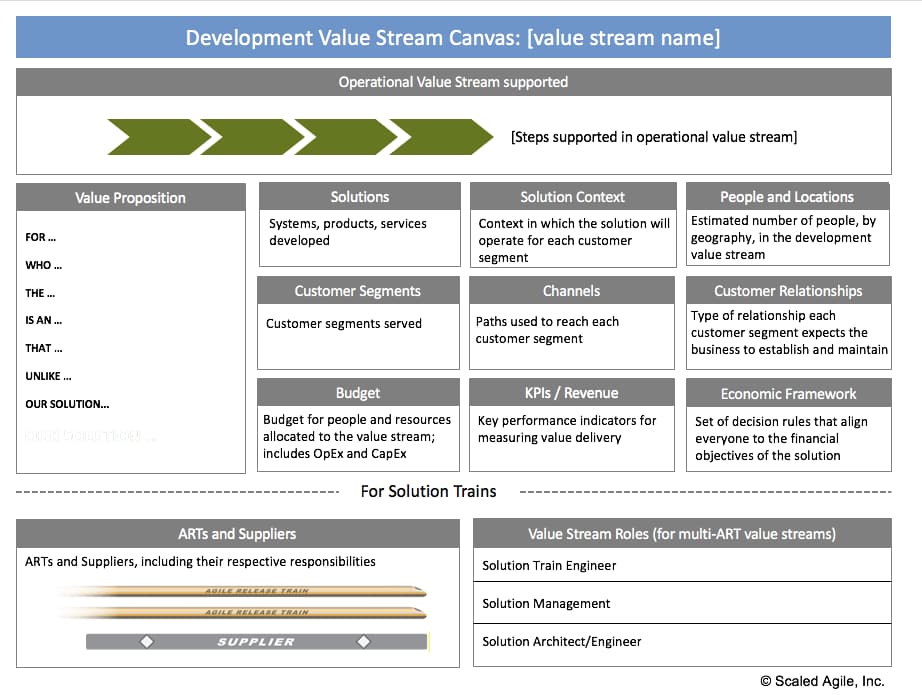
The Development Value Stream Canvas captures the key elements of how a value stream operates: the value proposition, solutions produced, solution context, who’s involved and where, development steps, funding, and key metrics.
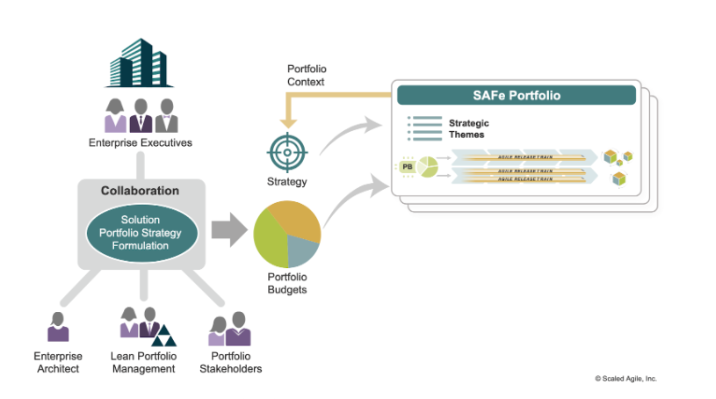
Strategic Themes
Strategic Themes are a collaboration between LPM and larger enterprises. They drive the future state of the portfolio, connecting it to the enterprise, and provide context for portfolio vision and lean budgeting. They represent differentiating business objectives.
Strategic themes are portfolio-level business objectives that provide competitive differentiation and strategic advantage. They provide business context for portfolio strategy and decision-making, representing aspects of the enterprise’s strategic intent.
This is frequently tested: Strategic Themes directly influence Lean Budget Guardrails.
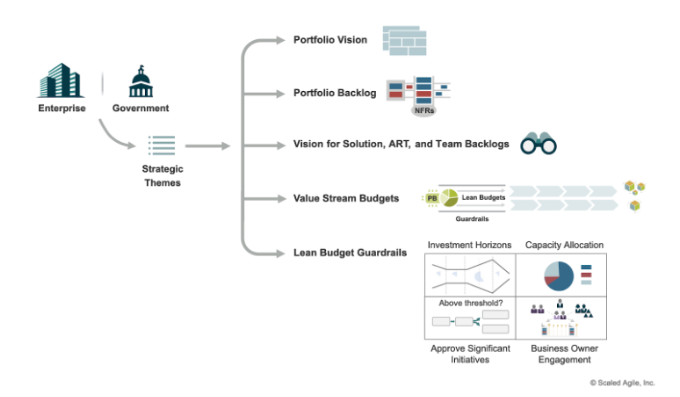
Strategic Themes influence everything from vision to budgeting to capacity allocation. They’re the bridge between enterprise strategy and portfolio execution.
OKRs (Objectives and Key Results)
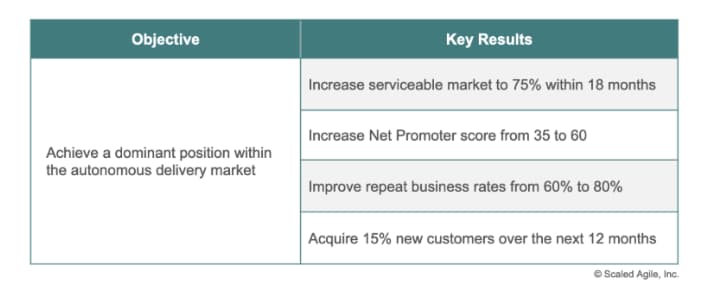
OKRs provide a framework for translating Strategic Themes into measurable outcomes. The Objective describes what you want to achieve; Key Results define how you’ll measure success.
Lean Budget Guardrails
Lean Budget Guardrails describe the policies and practices for budgeting, spending, and governance for a specific portfolio.
Fund Value Streams, not Projects because it allows for full control of spend, no costly variance analysis, no resource reassignments, and no blame game for project overruns.
The portfolio’s total budget is allocated to individual value streams by Lean Portfolio Management (LPM) and portfolio stakeholders.
The Lean Portfolio Management (LPM) competency aligns strategy and execution.
Lean Portfolio Management is responsible for managing the portfolio kanban, coordinated by the Epic Owner.
Lean Portfolio Management Dimensions
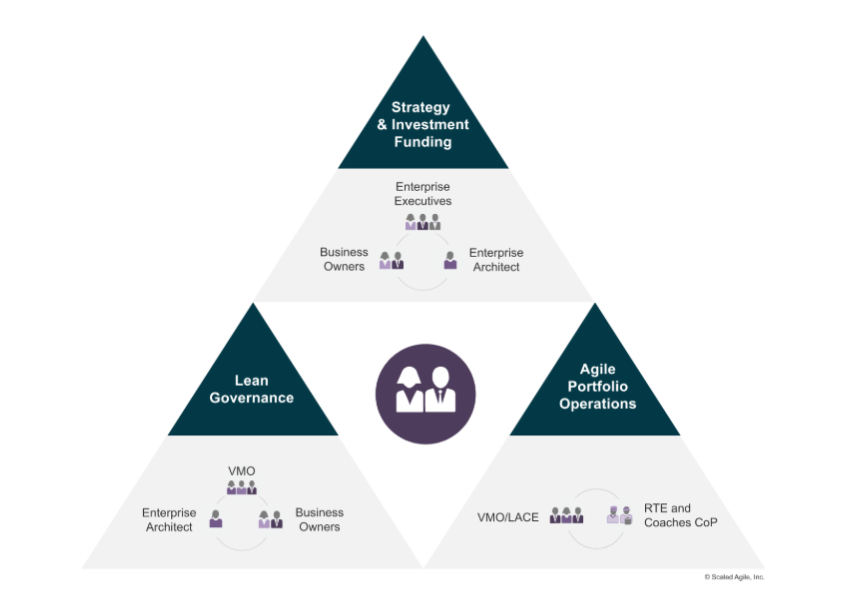
Strategy and Investment Funding connects portfolio to enterprise strategy, establishes Lean budgets and guardrails, and funds value streams.
Lean Governance supports oversight of spending, audit, compliance, expenditure, measurement, and reporting (frequently tested). This includes portfolio-level forecasting, participatory budgeting, and objective governance.
Agile Portfolio Operations coordinates and supports decentralized ART execution and fosters operational excellence (frequently tested). This includes establishing flow with Portfolio Kanban, enabling Continuous Exploration, and coordinating across value streams.
The Four Lean Budget Guardrails
Guardrail 1: Guiding Investments by Horizon
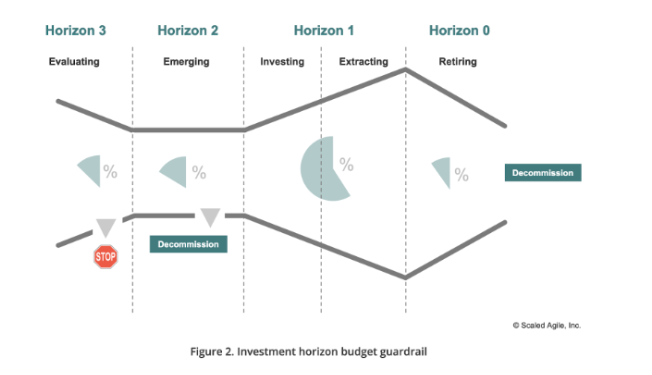
The investment horizon model helps balance innovation (Horizon 3), growth (Horizon 2), and optimization of existing solutions (Horizon 1), with some budget for decommissioning legacy systems (Horizon 0).
Guardrail 2: Applying Capacity Allocation to Optimize Value and Solution Integrity
This guardrail balances business features and enablers and maintenance. It’s the “split your capacity” guardrail—how much goes to new features vs. enablers vs. technical debt vs. maintenance?
Guardrail 3: Approving Significant Initiatives
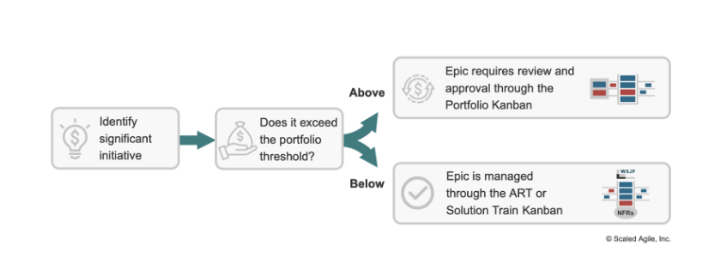
Epics that exceed the portfolio threshold require LPM approval. Smaller initiatives can be approved at the ART or Solution Train level. This prevents bottlenecks while maintaining governance for large investments.
Guardrail 4: Continuous Business Owner Engagement
Business Owners stay engaged throughout execution, not just during planning. They provide continuous guidance on priorities and validate that what’s being built delivers business value.
Portfolio Canvas
The Portfolio Canvas is used to capture the current state of the portfolio and provide input for defining the future state.
The portfolio’s Strategic Themes and SWOT and TOWS analysis are critical inputs to exploring alternatives for the future state.
SWOT analysis examines Strengths, Weaknesses, Opportunities, and Threats. TOWS analysis flips this to ask: how can we use our strengths to exploit opportunities? How can we shore up weaknesses to defend against threats?
Portfolio Kanban
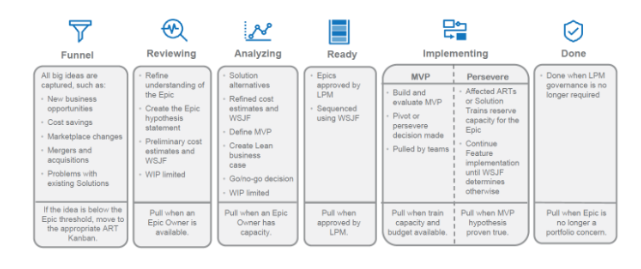
The Portfolio Kanban system describes the process states that an Epic goes through from the funnel to done. Each state is WIP limited (except the Funnel) to maintain flow.
Funnel: All big ideas are welcome here. No WIP limits. Reviewing: Initial assessment and WSJF scoring. Analyzing: Detailed business case, WSJF prioritization. Ready: Approved by LPM, waiting for capacity. Implementing: Being built across ARTs. Done: Value delivered, hypothesis validated.
Epics in the analyzing state that have the highest WSJF are pulled into the Portfolio Backlog. The Program (ART) Backlog contains Features, and the Team Backlog contains User Stories (frequently tested).
Iterations and the Innovation & Planning (IP) Iteration
Iterations are a standard, fixed-duration timebox during which Agile Teams and ARTs individually and collectively deliver incremental customer value while working towards the PI objectives.
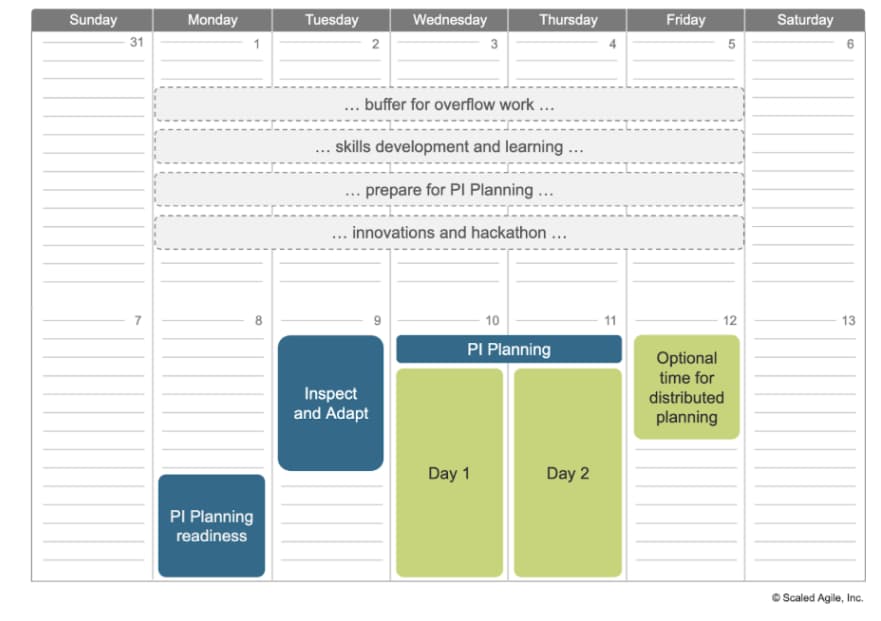
Each Planning Interval (PI) typically has four two-week development Iterations followed by one Innovation and Planning (IP) Iteration.
The Innovation and Planning (IP) Iteration
The IP Iteration is a unique, dedicated iteration that occurs every PI. It is specifically allocated for innovation and exploration and happens once every PI.
The IP Iteration provides an estimating buffer for meeting PI Objectives, dedicated time for innovation, time for continuing education, time for PI Planning itself, and time for the Inspect and Adapt (I&A) event.
Benefits include enabling advanced development infrastructure, enabling Continuous Learning, providing a built-in estimation buffer, and protecting time for innovation.
Buffer Concept
Lean flow teaches us that 100 percent utilization drives unpredictable results. Planning everyone to total capacity does not allow people the ability to flex when problems inevitably occur. The result is unpredictability and delays in value delivery.
As a countermeasure, the IP iteration offers a ‘guard band’ (or buffer) to prevent unfinished work from the current PI from carrying over to the following PI.
Without the IP Iteration, teams often find themselves with no slack in the system. Everything is scheduled to 100% capacity, which means any surprise or delay cascades into missed commitments. The IP Iteration provides a buffer that makes the overall system more predictable and sustainable.
PDCA Cycle
Every iteration follows the Plan-Do-Check-Adjust cycle: Plan (determine the goals for the timebox and identify the work needed), Do (rapidly deliver small increments of the Solution), Check (review, demonstrate, and analyze the results and learnings), and Adjust (adjust and start a new cycle).
PI System Demos and Inspect & Adapt
PI System Demos
The ART objectively measures progress with a regular series of System Demos.
The timebox ends with the PI System Demo, the first part of the Inspect and Adapt (I&A) event. This demo shows all the Features the ART has developed during the entire PI.
During the I&A, Business Owners score PI objectives and assess product/solution performance. Additionally, everyone in the ART collaborates to identify and address systemic problems in the problem-solving workshop portion of the I&A.
Inspect and Adapt (I&A)
The I&A workshop is held at the end of every PI and consists of three parts:
1. The PI System Demo
At the end of the PI, teams demonstrate the current state of the Solution to the appropriate stakeholders. Often led by Product Management, Product Owners, and the System Team. Attended by Business Owners, ART stakeholders, Product Management, RTE, Scrum Masters/Team Coaches, and teams.
2. Quantitative and Qualitative Measurement
This is where the ART reviews metrics to understand performance.
Competency Metrics include one assessment for each of the Seven Core Competencies, assessing at a greater level of detail to generate deeper insights, measuring progress toward a specific core competency, and identifying specific practices for potential improvement.
Flow Metrics include six primary metrics:
Flow Distribution: The amount of each type of work in the system over time. Flow Velocity: The average number of work items that can be completed in a given timeframe. Flow Time: How long it takes for a work item to go through the system. Flow Load: The overall amount of WIP in the system. Flow Efficiency: How much of the overall flow time is spent in value-added work activities vs. waiting between steps. Flow Predictability: Overall planned vs. actual business value achieved.
Eight Flow Accelerators: Visualize and limit WIP, Address bottlenecks, Minimize handoffs and dependencies, Get faster feedback, Work in smaller batches, Reduce queue lengths, Optimize time ‘in the zone’, and Remediate legacy policies and practices.
Outcomes Metrics include Key performance indicators (KPIs) that measure how a Value Stream is performing against its business objectives, Objectives and Key Results (OKRs) as a goal-setting framework that evaluates progress toward achieving business outcomes, and Employee engagement that measures how motivated individuals are in supporting achievement of the organization’s goals and values.
3. Retrospective and Problem-Solving Workshop
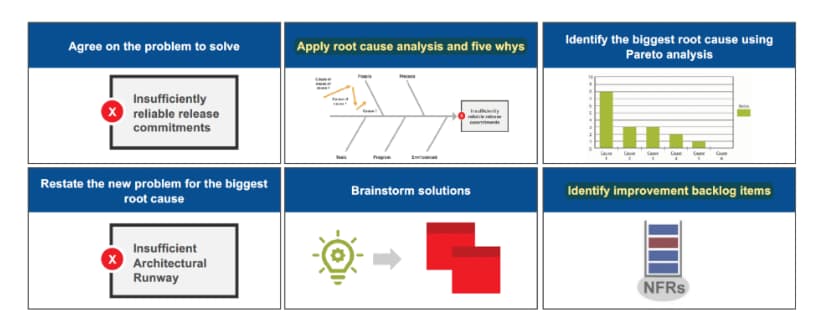
The problem-solving workshop uses structured techniques: Agree on the problem to solve, apply root cause analysis (5 Whys, fishbone diagrams), identify the biggest root cause using Pareto analysis, restate the new problem for the biggest root cause, brainstorm solutions, and identify improvement backlog items.
Improvement items become Enablers in the backlog, ensuring that retrospective insights lead to action.
Timebox: Three to four hours per PI. Attendees: Teams and stakeholders.
PI Planning
Program Increment (PI) Planning is a cadence-based event that serves as the heartbeat of the ART, aligning all teams on the ART to a shared mission and vision.
This is frequently tested: PI Planning is usually 2 days long and happens at the beginning of every PI.
Two days every 8-12 weeks, everyone plans together. Product Management owns feature priorities. Development teams own story planning and high-level estimates. System Architect and UX work as intermediaries for governance, interfaces, and dependencies.
It is facilitated by the RTE, and event attendees include Business Owners, Product Management, Agile Teams, System and Solution Architects, the System Team, and other stakeholders.
The RTE must schedule all PI planning in advance to be well prepared. The active participation of Business Owners in this event provides an essential Guardrail on budgetary spending.
Business Benefits of PI Planning
PI Planning establishes face-to-face communication among all team members and stakeholders, builds the social network the ART depends upon, aligns development to business goals with the business context, vision, and Team and ART PI objectives, identifies dependencies and fosters cross-team and cross-ART collaboration, provides the opportunity for just the right amount of architecture and Lean User Experience (UX) guidance, matches demand to capacity and eliminates excess Work in Process (WIP), and enables fast decision-making.
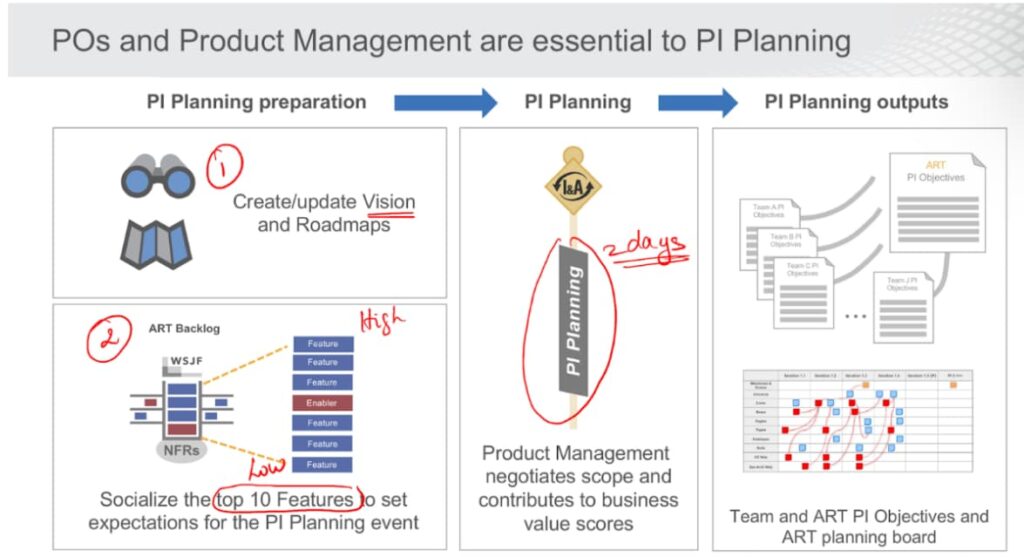
Inputs to PI Planning
Business context (see ‘content readiness’ below), Roadmap and vision, and the highest priority Features of the ART Backlog (the top 10 Features).
Outputs of PI Planning
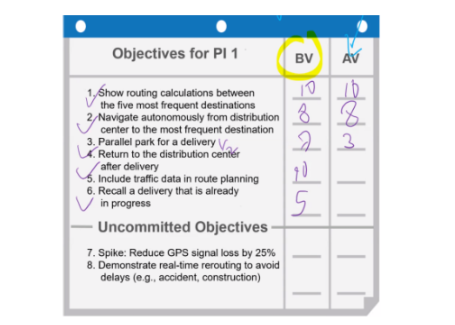
Committed PI Objectives—Each team creates a set of SMART objectives with the business value assigned by the Business Owners.
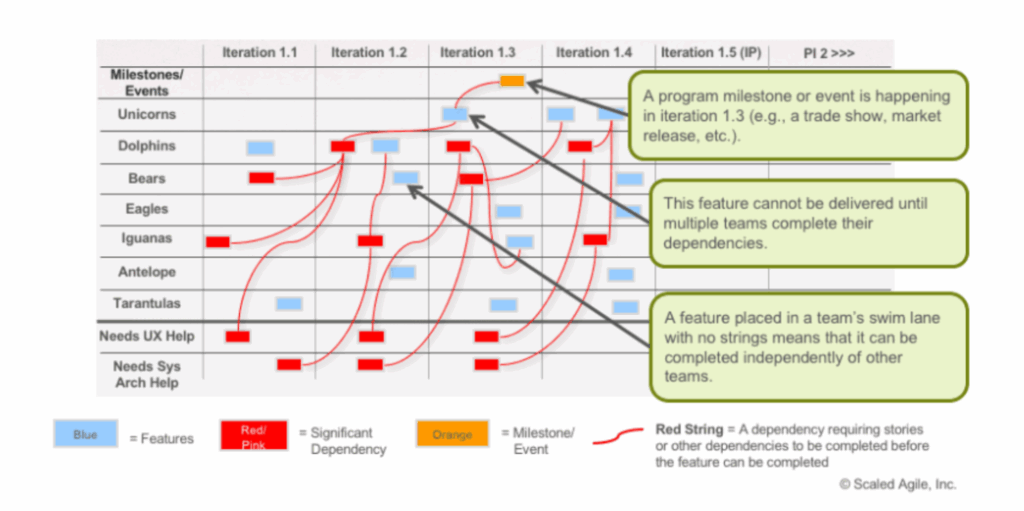
ART Planning Board—Highlighting the new feature delivery dates, feature dependencies among teams, and relevant milestones.
Preparation: Three Areas of Readiness
For the event to be successful, preparation is required in three major areas:
Organizational Readiness includes Planning Scope and Context, Business Alignment, and Agile Teams.
Content Readiness includes an Executive Briefing (a briefing that defines the current business context), Product Vision Briefing(s) (briefings prepared by Product Management, including the top 10 features in the ART Backlog—frequently tested), and Architecture Vision Briefing (a presentation made by the CTO, Enterprise Architect, or System Architect to communicate new Enablers, features, and Nonfunctional Requirements).
Logistics Readiness includes Locations, Technology and tooling, and Communication channels.
The Two-Day PI Planning Agenda
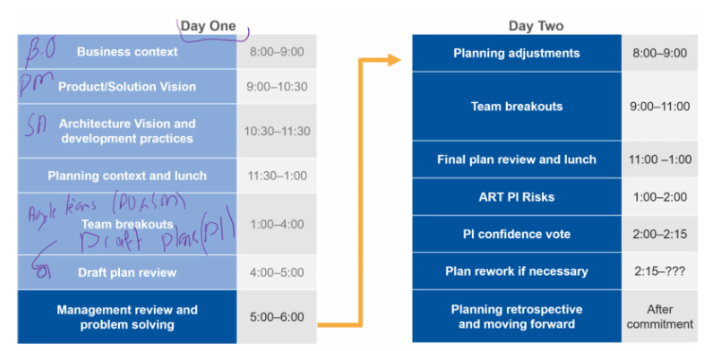
Day 1 of PI Planning
Business Context
A senior executive/line-of-business owner describes the current state of the business and presents a perspective on how well existing solutions are addressing current customer needs.
Product/Solution Vision
Product management presents the current program vision (typically represented by the top 10 upcoming features) and highlights any changes from the previous PI planning meeting, as well as any forthcoming milestones.
Product Manager owns Features.
Architecture Vision and Development Practices
System Architect/Engineering presents the architecture vision. Also, a senior development manager may introduce Agile-supportive changes to development practices, such as test automation, DevOps, continuous integration, and continuous deployment, which are being advanced in the upcoming PI.
Planning Context and Lunch
The Release Train Engineer presents the planning process and expected outcomes of the event.
Team Breakouts #1
In the breakout, teams estimate their capacity for each iteration and identify the backlog items they will likely need to realize the features (frequently tested).
Each team creates their draft plans, visible to all, iteration by iteration (frequently tested). During this process, teams identify risks and dependencies and draft their initial team PI objectives.
Uncommitted Objectives
The PI objectives typically include uncommitted objectives, which are goals built into the plan but are not committed to by the team because of too many unknowns or risks.
Key points about uncommitted objectives (frequently tested concepts):
Uncommitted objectives are planned and aren’t extra things teams do “just in case they have time.”
Uncommitted objectives are not included in the commitment, to make the commitment more reliable.
If a team has low confidence in meeting a PI Objective, the PI Objective should be ‘uncommitted.’
If an objective has many unknowns, consider moving it to ‘uncommitted,’ and put in early spikes.
Uncommitted objectives count when calculating load.
Uncommitted objectives increase the reliability of the plan and give management an early warning of any objectives that the ART may not be able to deliver.
Uncommitted Objectives Benefits include improved economics, increased reliability, and adaptability to change.
Draft Plan Review
During the tightly timeboxed draft plan review, teams present key planning outputs, which include capacity and load, draft PI objectives, potential risks, and dependencies. Business Owners, Product Management, and other teams and stakeholders review and provide input.
Management Review and Problem-Solving
Draft plans likely present challenges like scope, people and resource constraints, and dependencies. During the problem-solving meeting, management may negotiate scope changes and resolve other problems by agreeing to various planning adjustments.
The RTE facilitates and keeps the primary stakeholders together for as long as necessary to make the decisions needed to reach achievable objectives.
This is when planning adjustments are agreed upon.
Strategies for Managing Dependencies:
Bottlenecks: Distribute work to other teams. Iteration dependencies: Adjust work sequencing to eliminate same-iteration dependencies. Unbalanced teams: Adjust work between teams based on forecast capacity. Complex critical path: Adjust work between teams or split Features and Stories.
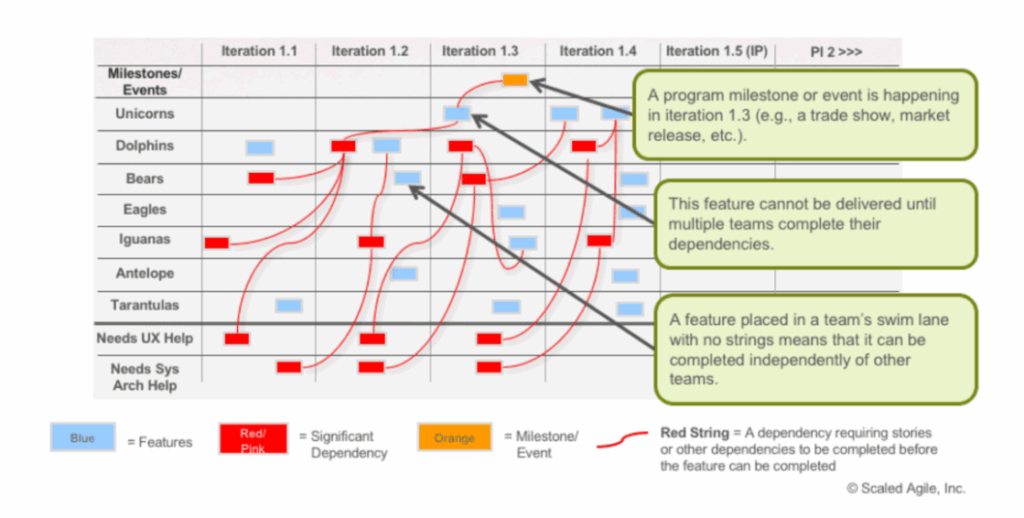
The program board makes dependencies visible. Red strings (or lines on digital boards) connect features that depend on each other. Too many red strings indicate the plan may be fragile.
Day 2 of PI Planning
Planning Adjustments
The next day, the meeting begins with managers describing any changes to planning scope and resources. Planning adjustments are used to adjust business priorities (frequently tested).
Team Breakouts #2
Teams continue planning based on their agenda from the previous day, making the appropriate adjustments. They finalize their objectives for the PI, to which the Business Owners assign business value.
What POs and PMs Do During PI Planning
Day 1: Communicate the Vision, Communicate Top 10 Features, Support team breakouts, Collaborate to decompose features into stories, Negotiate scope, Review draft PI plans and provide feedback, Participate in management review of draft plans.
Day 2: Support team breakouts, Accept team PI Objectives, Establish business value with Business Owners, Participate in final plan review, Provide feedback on ART PI Risks, Participate in confidence vote.
Final Plan Review and Lunch
During this session, all teams present their plans to the group. At the end of each team’s time slot, the team states their risks and impediments, but there is no attempt to resolve them in this short timebox.
If the plan is acceptable to the customers, the team brings their program PI objective sheet and program risk sheet to the front of the room so that all can see the aggregate objectives unfold in real time.
ART PI Risks (ROAM)
During planning, teams have identified program-level risks and impediments that could impact their ability to meet their objectives. These are resolved in a broader management context in front of the whole train.
One by one, the risks are addressed with honesty and transparency, and then categorized into one of the following categories:
Resolved — The teams agree that the issue is no longer a concern. Owned — Someone on the train takes ownership of the item since it cannot be resolved at the meeting. Accepted — Some risks are just facts or potential problems that must be understood and accepted. Mitigated — Teams can identify a plan to reduce the impact of an item.
PI Confidence Vote
Once program risks have been addressed, teams vote on their confidence in meeting their program PI objectives.
Teams use a fist of five: 1 finger = No confidence, 5 fingers = High confidence, 3 fingers or above = Acceptable. If too many votes are below 3, the plan needs rework.
Plan Rework (if necessary)
If necessary, teams rework their plans until a high confidence level can be reached. This is one occasion where alignment and commitment are valued more highly than adhering to a timebox.
Planning Retrospective and Moving Forward
Finally, the RTE leads a brief retrospective for the PI planning event to capture what went well, what didn’t, and what can be done better next time.
PI Objectives
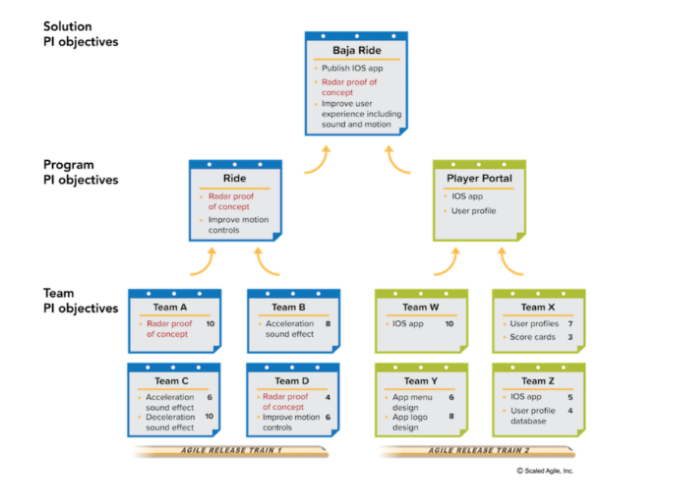
PI Objectives are a summary of the business and technical goals that each team and the overall ART intend to achieve in the upcoming PI.
This is frequently tested: PI Objectives are built largely from the bottom-up, as the teams estimate and identify them during PI Planning.
PI Objectives should reflect what is important to the business as well as other stakeholders. After the planning event, the RTE and other ART stakeholders summarize the individual team PI objectives into a set of ART PI objectives and use this to communicate externally and track progress toward the goals. Product Management uses the ART PI objectives to refine the roadmap, improving the forecast for the following two PIs.
Why Use PI Objectives? For immediate feedback, decentralized decisions, predictability without specificity, and commitment.
Distinguishing Features from PI Objectives
PI Objectives often relate directly to Features. Some Features can be delivered by individual teams; others require collaboration. In addition to Features and inputs to Features, other team objectives will appear. Focus on outcomes, not outputs. Describe the value and impact. Don’t use Features or Stories as PI Objectives as these can change.
The team’s PI objectives often relate directly to intended features; indeed, many are the same. However, the mapping is not always straightforward, since some features require the collaboration of multiple teams.
Writing SMART PI Objectives
Specific, Measurable, Achievable, Realistic, Time-bound.
Assigning Business Value to PI Objectives
Business Owners assign business value to each PI objective on a scale, typically 1-10. This isn’t arbitrary—it reflects the relative importance of each objective to business outcomes.
Business value categories include Regulatory Value, Commercial Value, Market Value, Future Value, and Efficiency Value.
The Requirements Hierarchy: Epics, Capabilities, Features, Stories, Enablers
This is frequently tested: Epics are the highest level of requirements in the hierarchy. Then are Capabilities, Features, and User Stories.
Summary of SAFe Requirements
An Epic is a container for a significant Solution development initiative that captures the more substantial investments that occur within a portfolio.
A Feature is a service that fulfills a stakeholder need. Each Feature includes a name, a benefit hypothesis, and acceptance criteria. A Feature is sized or split, as necessary, to be delivered by an ART in a PI.
A Story is a short description of a small piece of desired functionality. A Story is written from the perspective of the user.
An Enabler supports the activities needed to extend the Architectural Runway to provide future business functionality. Enablers are captured in various backlogs throughout SAFe.
Epics
An Epic is a significant Solution development initiative.
Two Types of Epics
Business Epics directly deliver business value.
Enabler Epics support the Architectural Runway and future business functionality.
Portfolio Epics are typically cross-cutting, typically spanning multiple Value Streams and PIs. Epics need a Lean business case, the definition of a minimum viable product (MVP), an Epic Owner, and approval by LPM. Epics in the analyzing state that have the highest WSJF are pulled into the Portfolio Backlog (frequently tested).
Epic Hypothesis Statement
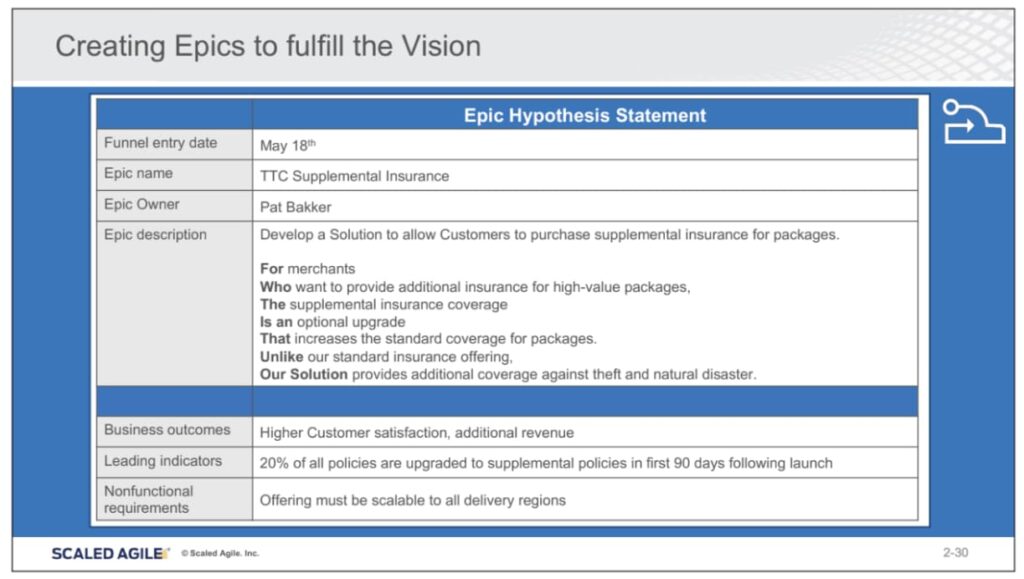
The Epic Hypothesis Statement captures the vision for the Epic in a structured format that drives clarity and alignment.
Major Fields include the Hypothesis Statement (For…Who…The…Is…Unlike…), Business outcomes (quantitative and qualitative benefits), Leading indicators (early measures that will help predict business outcomes), and Non Functional Requirements (NFRs).
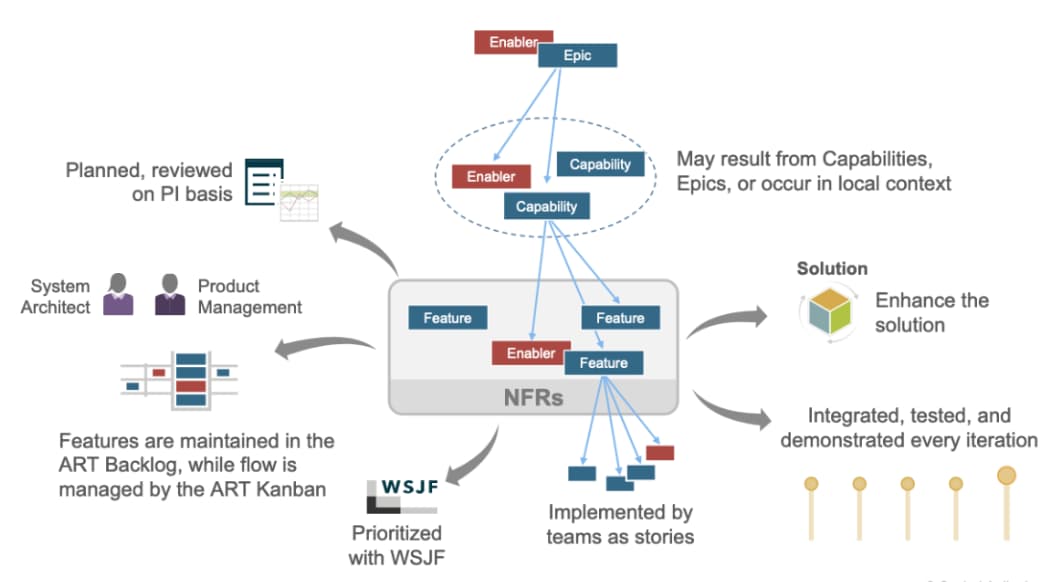
Features
Features represent the work for the ART. The ART Backlog is the holding area for upcoming Features that will address user needs and deliver business benefits for a single ART.
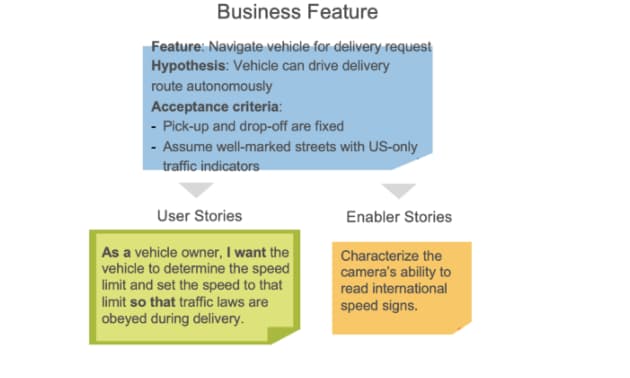
Two Types of Features
Business Features are Customer Centric, Deliver Business Value, and Deliver Functionality. They are owned by Product Managers. Business Features fit in one PI for one ART (frequently tested).
Enabler Features support future business requirements through exploration, architecture, and infrastructure and compliance requirements. They are owned by Architects/Engineers. Product Management collaborates with System Architects to balance business Features and Enablers and to ensure investment in just enough Architectural Runway.
Feature Attributes
Name: Clear, concise description. Benefit Hypothesis: Justifies development costs and provides business perspective. Acceptance Criteria: Defined during ART backlog refinement.
Capacity Allocation for Features
Determine how much capacity is to be allocated to each type (new features, enablers, tech debt, maintenance). Establish policies to determine how much work is performed for each type.
This balance is critical. Too many new features without enablers leads to technical debt. Too many enablers without new features means you’re not delivering customer value.
Stories
Stories are short descriptions of a small piece of desired functionality sized so that they can be completed in a single Iteration.
Types of Stories
User Stories express desired end-user functionality written in the user’s language.
Enabler Stories support exploration, architecture, infrastructure, and compliance.
Stories are created during PI Planning as the teams collaborate with POs and Product Management. Story format: As a (user role), I want (activity) so that (business value). Features fit in one PI for one ART; Stories fit in one Iteration for one team (frequently tested).
Stories — Team Backlog
The Team Backlog contains all the work for the team, is created by the PO and the team, and is prioritized by the PO (frequently tested). It contains User and Enabler Stories. User Stories provide Customers with value. Enabler Stories build the infrastructure and architecture that makes User Stories possible. Stories for near-term Iterations are more detailed than Stories for later Iterations. NFRs are backlog constraints.
INVEST in Good Stories
Independent — Can be developed and delivered independently. Negotiable — Details can be negotiated between PO and team. Valuable — Delivers value to the customer. Estimable — Team can estimate the effort. Small — Can be completed in one iteration. Testable — Has clear acceptance criteria.
10 Patterns for Splitting Features into Stories
When a Feature or Story is too large, split it using one of these patterns:
- Workflow steps — Identify specific steps that a user takes to accomplish a specific workflow.
- Business rule variations — Split by different business rules.
- Major effort — Separate the first implementation from variations.
- Simple/complex — Start with the simple version.
- Variations in data — Split by data sources or data types.
- Data entry methods — Different UI approaches.
- Defer system qualities — Basic implementation first, optimize later.
- Operations — CRUD operations (Create, Read, Update, Delete).
- Use case scenarios — Split by different scenarios.
- Break out a spike — When there’s uncertainty, do research first.
Spikes
Technical spikes are used to research various technical approaches in the Solution domain.
Functional spikes are used whenever there is significant uncertainty as to how a user might interact with the system.
Spikes are timeboxed research activities that reduce risk by exploring approaches before committing to implementation.
When is a Story Complete?
A Story is complete when it satisfies the Definition of Done (DoD). The definition of done requires that the Story satisfies the acceptance criteria and is accepted by the Product Owner.
Acceptance Criteria
Write acceptance criteria using behavior-driven development (BDD). Acceptance criteria are testable with ‘Given-When-Then’ syntax: Given (context), When (action), Then (expected result).
Enablers
Enablers are backlog items that extend the architectural runway of the solution under development or improve the performance of the development value stream.
Enablers build the runway. Types include Exploration (research and prototyping), Infrastructure (build environments, tools, platforms), Architecture (implement architectural features), and Compliance (address regulatory and governance requirements).
Enablers are captured in backlogs as a type of Epic, Capability, Feature, or Story.
Architectural Enablers
Architectural enablers are used to build, extend, and maintain the runway. The architectural runway consists of existing code, hardware components, marketing branding guidelines, etc. that enable near-term business Features.
Architectural enablers can also address problems with the resiliency of deployed solutions.
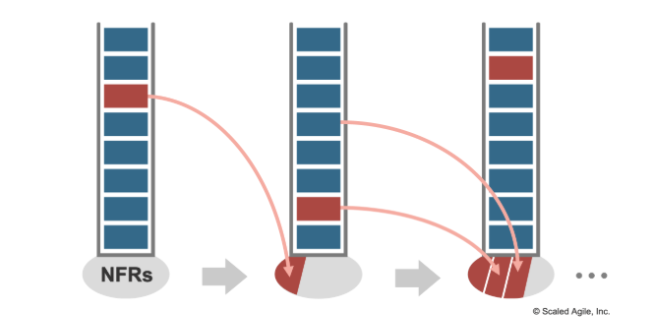
After implementation, these enablers often reflect Nonfunctional Requirements (NFRs) imposed on future backlog items.
NFRs often originate as architectural enablers and grow as a set over time.
Rules for Building the Architectural Runway (Frequently Tested)
- Time is of the essence. It should take no longer than a few iterations to implement and prove the new technology.
- Feature teams validate the new architecture.
- Credit goes to working solutions, not models and designs.
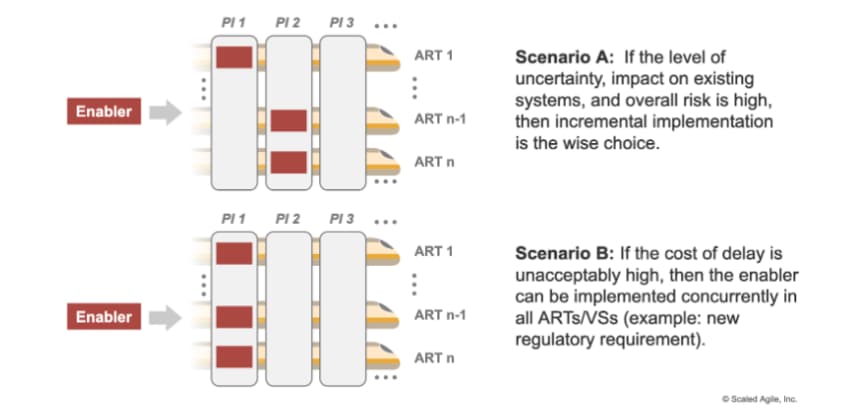
Implementing Enablers Across ARTs and Value Streams
Enabler epics and capabilities can cut across multiple value streams or ARTs. During the analysis stage of the appropriate Kanban system, it is important to determine whether to implement the enabler across all ARTs simultaneously or incrementally.
Nonfunctional Requirements (NFRs)
Nonfunctional Requirements (NFRs) are system qualities that guide the design of the solution and often serve as constraints across the relevant backlogs.
As opposed to functional requirements, which specify how a system responds to specific inputs, nonfunctional requirements are used to specify various system qualities.
Key distinction (frequently tested): Functional requirements are expressed as Capabilities, Features, and Stories (what the system does). Nonfunctional requirements specify system qualities (how well the system does it).
NFRs are not part of backlogs; instead they constrain backlogs.
System Qualities (NFR Examples)
Performance: How fast a system should respond to requests. Scalability: How well a system can handle an increase in users or workload. Security: How well a system protects against unauthorized access and data breaches. Usability: How easy a system is to use. Maintainability: How easy it is to update and modify the system. Reliability: How consistently the system performs. Availability: How much uptime the system provides.
Characteristics of Good NFRs
NFRs should be Bounded (NFRs must have a specific bounded context—”The system shall be fast” is meaningless, but “The search results page shall load in less than 2 seconds for 95% of requests” is bounded), Independent (NFRs should be independent of each other so that they can be evaluated and tested without consideration of other system qualities), Negotiable (Negotiability of NFRs is a crucial aspect of economic performance—perfect security might make the system unusable, perfect performance might be prohibitively expensive), and Testable (NFRs must be testable with objective measures—”User-friendly” isn’t testable, but “New users can complete the checkout process in under 3 minutes with 90% success rate” is testable).
NFRs in the Agile Testing Matrix
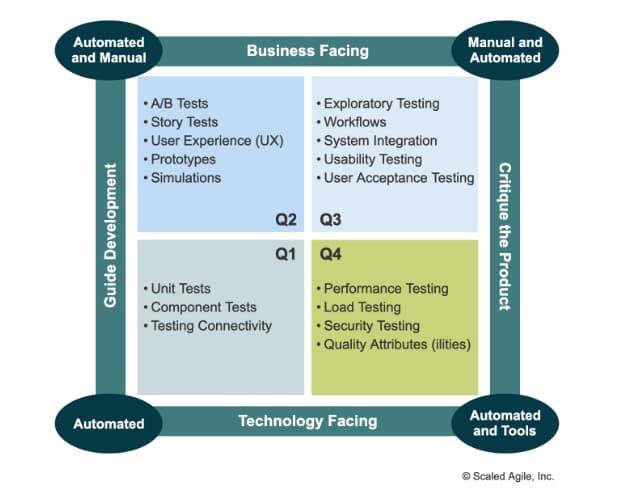
NFRs are in quadrant 4 of the Agile testing matrix (frequently tested)—technology-facing tests that critique the product.
Solution Intent and NFRs
Solution Intent includes NFRs and functional requirements and plays a crucial role in understanding the economics of fixed versus variable solution intent.
For highly regulated industries or complex systems, Solution Intent provides the definitive record of intended and actual system behavior, including all NFRs.
Kanbans: Multiple Connected Systems
Work in process (WIP) promotes flow and the continuous delivery of value. SAFe uses multiple connected Kanban systems at different levels of the organization.
The ART Kanban facilitates flow through the Continuous Delivery Pipeline.
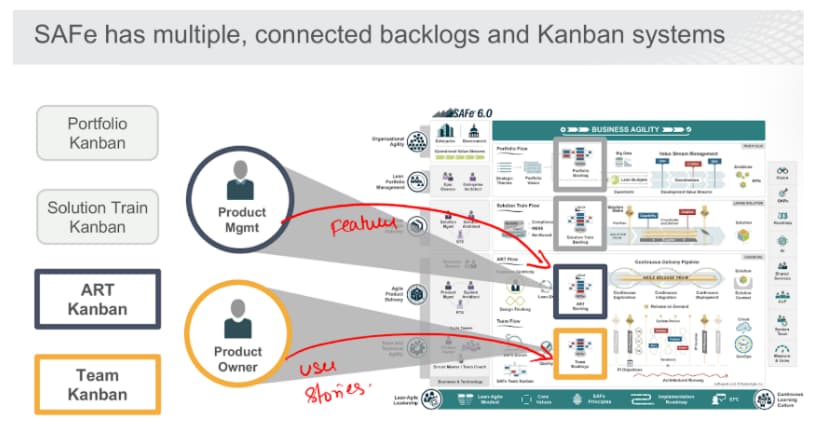
Each Kanban system has WIP limits, policies for moving work between states, and visualization to make the work transparent.
Prioritizing with WSJF (Weighted Shortest Job First)
In a flow system, job sequencing is the key to improving economic outcomes.
WSJF is a prioritization method based on Cost of Delay and Job Duration and allows sequencing execution in the most economically viable way (frequently tested).
Give preference to jobs with a shorter duration and higher Cost of Delay, using Weighted Shortest Job First.
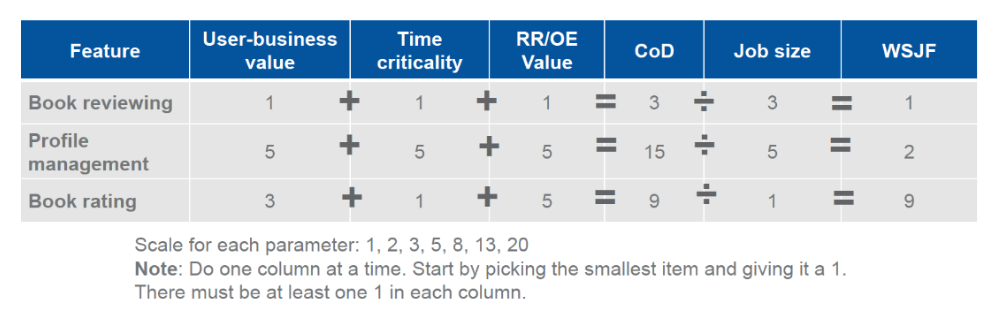
The WSJF Formula
WSJF = Cost of Delay (CoD) / Job Duration (Job Size)
Cost of Delay Components
Cost of Delay = User Business Value + Time Criticality + Risk Reduction/Opportunity Enablement
User-Business Value: Relative value to the Customer or business. Example: Revenue impact?
Time Criticality: How user-business value decays over time. Example: Will they wait for us or move to another solution?
Risk Reduction and Opportunity Enablement: What else does this do for our business? Example: Enable new business opportunities, reduce compliance risk, retire legacy systems.
WSJF Stakeholders
Business Owners, Product Management, POs, and System Architects collaborate on WSJF scoring.
Calculating WSJF
Simple example:
Feature A: Duration 1, CoD 10, WSJF 10 Feature B: Duration 3, CoD 3, WSJF 1 Feature C: Duration 10, CoD 1, WSJF 0.1
Go with Feature A—highest WSJF because it maximizes the value delivered in the shortest amount of time.
Prioritization Anti-Patterns to Avoid
HiPPo — The highest paid person makes the decision (ignores actual data and value).
Squeaky Wheel — The person who yells the loudest or makes the biggest promise of revenue (rewards noise over value).
ROI — The decision is made based exclusively on profit, without considering other factors (ignores strategic value, risk reduction, time criticality).
WSJF provides an objective, economics-based approach that considers multiple dimensions of value and urgency.
Iteration Planning
Iteration Planning refines the Iteration plans created during PI Planning.
Team Backlog Inputs
The Team Backlog receives input from multiple sources:
ART Backlog — Features flowing down from Product Management.
Team Context: Refactors, Maintenance, Other technical debt.
Other Stakeholders: Other team dependencies, Other commitments, Spikes/research.
Stories can be added, modified, removed, or reprioritized (frequently tested).
NFRs are a constraint on the backlog.
Sequencing Stories
The Product Owner and the team sequence work based on story priorities inherited from ART Backlog priorities, events, milestones, releases, and other commitments made during PI Planning, dependencies with other teams, local priorities, and capacity allocations for defects, maintenance, and refactors.
Initial sequencing happens during PI Planning. Adjustments happen at Iteration boundaries.
Iteration Planning Agenda
- Establishing capacity
- Story analysis and estimating
- Detailing Stories
- Developing Iteration Goals
- Committing to Iteration Goals
1. Establishing Capacity
Team applies capacity allocation to the Team Backlog.
The team quantifies capacity to perform work in the upcoming Iteration. Each team member determines their availability, acknowledging time off and other potential duties.
The Product Owner, in collaboration with the team, selects the highest priority backlog items for each slice of the capacity allocation to implement in an Iteration.
Benefits of Capacity Allocation include helping alleviate velocity degradation due to technical debt and keeping existing Customers happy with bug fixes and enhancements.
Can change at Iteration or PI boundaries.
Using Velocity to Establish Capacity
Establish velocity by looking at the average output of the last Iterations.
Example: 180 story points / 6 iterations = 30 Story Points per iteration.
Establishing Capacity Before Historical Data Exists
When you’re just starting and don’t have historical velocity:
- Give the team eight points for every full-time developer and tester on the team; adjust for part-time individuals.
- Subtract one point for every team member vacation day and holiday.
- Find a small Story that would take about a half day to develop and a half day to test and validate, and assign it one point.
- Estimate every other Story relative to that one-point Story.
Story Points
A Story point is a number that represents Volume (how much there is), Complexity (how difficult it is), Knowledge (what we know), and Uncertainty (what’s not known).
Key principles (frequently tested):
The smallest story is 1 Story Point or 1 day, comprising ½ a day to develop and ½ a day to test.
An iteration only has 8 days or 8 SP’s of work, not 10 — Because of planning activities, the sprint’s first day is for planning and last day for retrospective.
Story points are relative, not absolute. They represent relative effort compared to other stories the team has completed.
2-5. Story Analysis, Detailing, Goals, and Commitment
Teams analyze stories to understand requirements, detail them with acceptance criteria, develop iteration goals that align with PI Objectives, and commit to what they believe they can deliver.
Tips for Effective Iteration Planning
Anti-patterns to avoid: Delving too deep into technical discussions (save detailed design for during the iteration), Prioritized Stories don’t align to the business objectives or the team’s PI Objectives, Bringing Stories that haven’t been refined and prioritized, PO directs the team on how the work should be done (tell them what, not how), The team under-commits due to fear of failure, No time is reserved for support activities (support, production issues, etc.).
Backlog Refinement
Backlog refinement is a preview and elaboration of upcoming Stories.
Backlog refinement is ongoing throughout the PI, not just during planning events. Teams and Product Owners collaborate regularly to break down upcoming Features into Stories, add detail and acceptance criteria to Stories, estimate Stories, identify dependencies and risks, and ensure the backlog has enough ready Stories for upcoming iterations.
The Iteration Review
The Iteration Review provides the true measure of progress by showing working software functionality, hardware components, and demonstrable value.
Sample Iteration Review Agenda:
- Review business context and Iteration Goals
- Demo and solicit feedback on each Story, spike, refactor, and NFR
- Discuss Stories not completed and why
- Identify risks or impediments
- Revise Team Backlog and team PI Objectives as needed
Scalable Definition of Done
Team Increment: Stories satisfy acceptance criteria, Stories accepted by PO.
System Increment: Completed Features, Accepted by Product Management.
Solution Increment: Capabilities Completed, Accepted by Solution Management.
Release: Released to customers, Value delivered.
This scalable definition ensures quality is built in at every level, not just inspected in at the end.
The Iteration Retrospective
The Iteration Retrospective is where teams reflect on their process and identify improvements.
Enter improvement items into the Team Backlog — this is critical. Retrospective insights must lead to action, not just discussion.
Inputs to the retrospective include iteration goals, the team’s increment, the list of improvement stories and actions taken since the last retrospective, and the collection of agreed-to iteration metrics.
Outputs include creation of a few improvement stories and updates to the team backlog.
Core questions: What went well? What didn’t go well? What should we do better next time?
The retrospective has both qualitative (discussion) and quantitative (metrics review) components.
Content Authority: Product Manager vs. Product Owner
Understanding who owns what is critical for effective governance and is frequently tested.
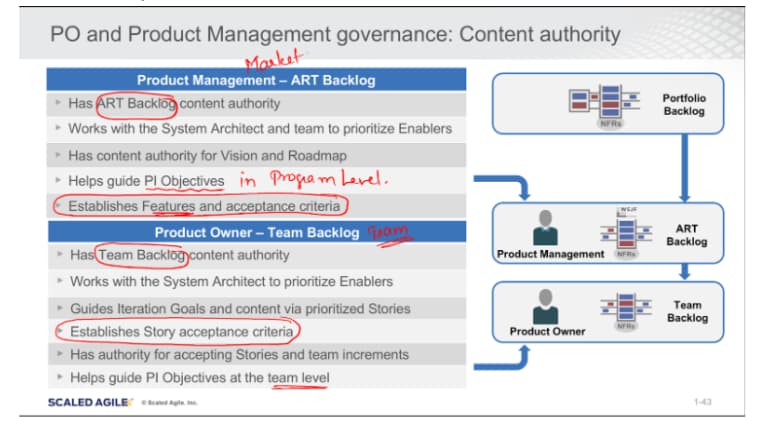
Product Management creates the Vision for the ART.
Product Owners contribute to the Vision, which evolves from Customer Feedback.
Product Owner Responsibilities
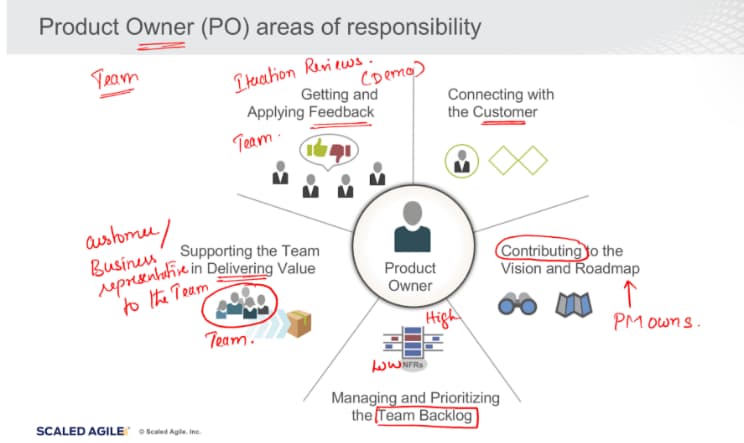
The Product Owner has five primary areas of responsibility:
- Connecting with the Customer
- Contributing to the Vision and Roadmap
- Managing and Prioritizing the Team Backlog
- Supporting the Team in Delivering Value
- Getting and Applying Feedback
Product Manager Responsibilities
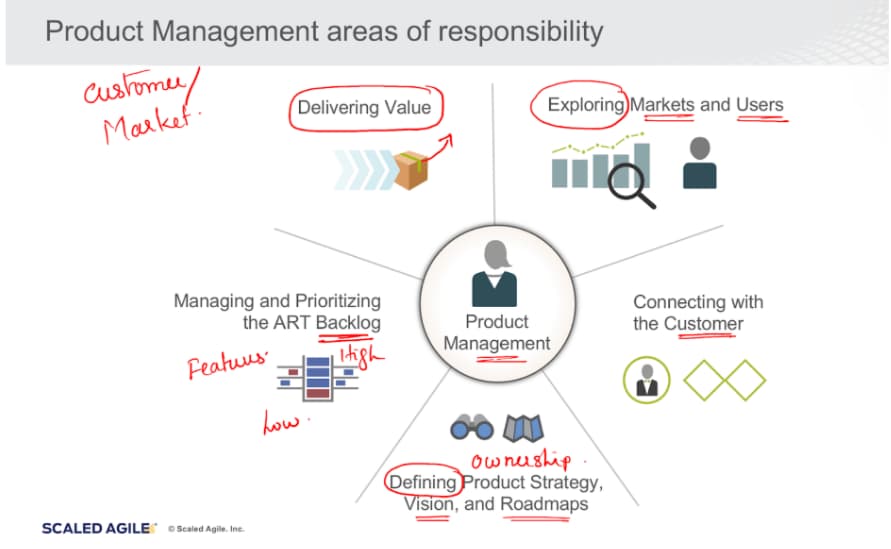
Product Management has five primary areas of responsibility:
- Exploring Markets and Users
- Defining Product Strategy, Vision, and Roadmaps
- Managing and Prioritizing the ART Backlog
- Connecting with the Customer
- Delivering Value
Conclusion
Parts 1 and 2 gave you SAFe’s foundation — the principles, mindset, and organizational structure that make business agility possible. Part 3 showed you how it actually works: how teams plan together, how work flows through the continuous delivery pipeline, how portfolios align strategy to execution, and how every level stays connected to customer value.
SAFe isn’t a framework you adopt. It’s an operating system you run. It requires commitment from leadership, discipline from teams, and relentless focus on delivering value.
The Implementation Roadmap isn’t linear. PI Planning isn’t just a meeting. The Continuous Delivery Pipeline isn’t just automation. These are living practices that organizations must continuously refine and adapt.
The organizations that succeed with SAFe embrace its full scope — not just the ceremonies but the mindset, not just the roles but the culture, not just the artifacts but the alignment.
If you’re preparing for SAFe certification, these three parts cover what you need to know. If you’re leading a transformation, they provide the roadmap. If you’re trying to understand how large organizations can move fast without breaking things, you now have the answer.