During my fellowship at StartupML, I worked on Adversarial.AI—an ambitious project aimed at building a generalized machine learning framework to detect adversarial behavior across multiple domains. From information security breaches to money laundering and transaction fraud, the goal was to create a system that could learn patterns of malicious activity without extensive manual feature engineering.
While confidentiality restrictions prevent me from sharing the proprietary code, this post walks through the key concepts, methodologies, and insights I gained while working on fraud detection using network graph analysis and honeypot systems. Here's how we turned raw network traffic into actionable intelligence.
Introduction
Due to StartupML's strict confidentiality, I am unable to share detailed code related to this project. This post instead highlights key themes and concepts related to the project. The goal of Adversarial.AI is to create a generalized framework that can apply machine learning techniques to a variety of adversarial use cases including information security, money laundering, and transaction fraud.
The technical approach involves a cloud system that learns from many datasets. In order to generalize to multiple domains without extensive manual feature engineering, the system leverages graph representation and relies on some unsupervised feature extraction techniques.
Background
Our approach to detecting malicious network activity relied on several key technologies:
- Suricata: Network flows were viewed through Suricata, a Network IDS, IPS and Network Security Monitoring engine. We used a dockerized version of Suricata, which allowed us to run multiple honeypot daemons on the same network interface.
- Cloud Infrastructure: These networks had low and high interaction simulated servers connected through an Amazon Web Service EC2 instance.
- T-pot Honeypots: A T-pot is a honeypot daemon used to resemble real world sites to process and collect traffic from hackers.
Data Preparation
Imports
The project required several Python libraries for data manipulation, visualization, and network analysis:
# General
import pandas as pd
import numpy as np
import json
import os
from IPython.display import Image
from glob import glob

# Graphing
import matplotlib.pyplot as plt
pd.options.display.mpl_style = 'default'
%matplotlib inline
import pylab as pylab

# NetworkX
import networkx as nx
from multiprocessing import Pool
import itertools
import community
from multiprocessing import Pool
import itertools

# Other
import warnings
warnings.filterwarnings('ignore')
Destination and Source IP Representation
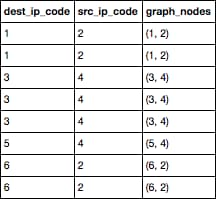
Each traffic log contained a destination and source IP address identifier. I created a Python script that assigns ascending numerical values for destination and source nodes by row and creates tuples of these nodes for edge graphing. The outcome of this are three lists that are used in subsequent sections to graph connections:
- List of destination IP codes
- List of source IP codes
- List of graph edge nodes (tuples of destination and source IP codes)
The following graph would produce a total of six points (1 through 6) and lines would be drawn between them based on graph node tuples. For example, a line would be drawn:
- Twice between code dot #1 and code dot #2
- Three times between code dot #3 and code dot #4
- Once from code dot #4 to new code dot #5
- Twice between code dot #2 to new code dot #6
NetworkX Analysis
The code below is based on a NetworkX example with social networks that can be found at this NetworkX blog. It serves as an example of the types of graphical analysis done with honeypot logs.
Key Insight: By creating graphical representations of traffic flow with identifiers for fraudulent traffic, patterns can be detected that will show anomalies that represent hackers.
G_fb = nx.read_edgelist("data/facebook_combined.txt", create_using = nx.Graph(), nodetype = int)

#Quick snapshot of the Network
print nx.info(G_fb)

#Create network layout for visualizations
spring_pos = nx.spring_layout(G_fb)
plt.axis("off")
nx.draw_networkx(G_fb, pos = spring_pos, with_labels = False, node_size = 35)
Parallel Betweenness Centrality
How do we determine who is the most "important" individual in the network? Well, that depends on the definition of "important". One way to define "importance" is the individual's betweenness centrality. The betweenness centrality is a measure of how many shortest paths pass through a particular vertex. The more shortest paths that pass through the vertex, the more central the vertex is to the network.
def partitions(nodes, n):
    "Partitions the nodes into n subsets"
    nodes_iter = iter(nodes)
    while True:
        partition = tuple(itertools.islice(nodes_iter,n))
        if not partition:
            return
        yield partition

def btwn_pool(G_tuple):
    return nx.betweenness_centrality_source(*G_tuple)

def between_parallel(G, processes = None):
    p = Pool(processes=processes)
    part_generator = 4*len(p._pool)
    node_partitions = list(partitions(G.nodes(), int(len(G)/part_generator)))
    num_partitions = len(node_partitions)

    bet_map = p.map(btwn_pool,
                        zip([G]*num_partitions,
                        [True]*num_partitions,
                        [None]*num_partitions,
                        node_partitions))

    bt_c = bet_map[0]
    for bt in bet_map[1:]:
        for n in bt:
            bt_c[n] += bt[n]
    return bt_c

bt = between_parallel(G_fb)
top = 10

max_nodes =  sorted(bt.iteritems(), key = lambda v: -v[1])[:top]
bt_values = [5]*len(G_fb.nodes())
bt_colors = [0]*len(G_fb.nodes())
for max_key, max_val in max_nodes:
    bt_values[max_key] = 150
    bt_colors[max_key] = 2

plt.axis("off")
nx.draw_networkx(G_fb, pos = spring_pos, cmap = plt.get_cmap("rainbow"),
                 node_color = bt_colors, node_size = bt_values, with_labels = False)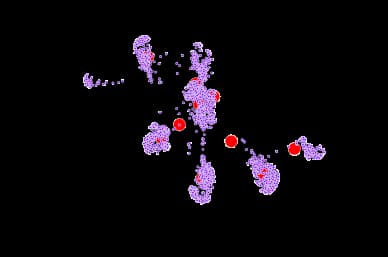
Create Most Important Labels
Basis of function found at this Betweenness-Centrality blog post.
The function below defines the most important label nodes and their "Betweenness Centrality":
def most_important(G):
    """ returns a copy of G with the most important nodes according to the pagerank """
    ranking = nx.betweenness_centrality(G).items()
    r = [x[1] for x in ranking]
    m = sum(r)/len(r) # mean centrality
    t = m*10 # threshold, we keep only the nodes with 3 times the mean
    Gt = G.copy()
    for k, v in ranking:
        if v < t:
            Gt.remove_node(k)
    new_ranking = nx.betweenness_centrality(Gt).items()
    print new_ranking
    print len(new_ranking)
    return Gt
Significance of numbers:
- Larger number indicates node is more central
- Smaller number indicates node is on the outside and has to travel across more edges to connect to other nodes
G_labels = most_important(G_fb)

# Create network layout for visualizations
spring_pos = nx.spring_layout(G_fb)
plt.axis("off")
nx.draw_networkx_nodes(G_fb,spring_pos,node_color='r',alpha=0.4,node_size=35)
nx.draw_networkx_edges(G_fb,spring_pos,alpha=0.1)
nx.draw_networkx_labels(G_labels,spring_pos,font_size=20,font_color='b')
plt.figure(figsize=(12,8))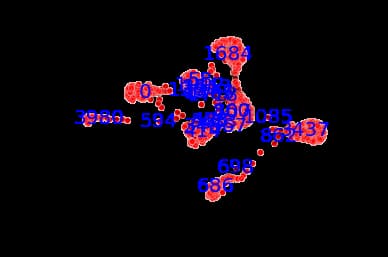
Community Detection
The criteria for finding good communities is similar to that for finding good clusters. We want to maximize intra-community edges while minimizing inter-community edges. Formally, the algorithm tries to maximize the modularity of network, or the fraction of edges that fall within the community minus the expected fraction of edges if the edges were distributed by random. Good communities should have a high number of intra-community edges, so by maximizing the modularity, we detect dense communities that have a high fraction of intra-community edges.
parts = community.best_partition(G_fb)
values = [parts.get(node) for node in G_fb.nodes()]
plt.axis("off")
nx.draw_networkx(G_fb, pos = spring_pos, cmap = plt.get_cmap("jet"),
                 node_color = values, node_size = 35, with_labels = False)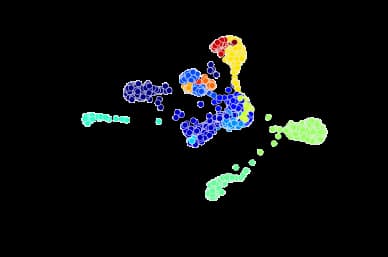
Other Detection Methods
Adversarial.AI also looked into other fraud detection methods related to credit card fraud. It involved writing Python scripts to scrape, detect, and log credit card information that was being posted fraudulently as fake advertisements on anonymous messaging websites.
Conclusion
Working on Adversarial.AI showed me the prevalence of information security attacks and how important and challenging it can be to detect them. Fraudulent traffic and hacking is widespread and can have drastic consequences for parties involved.
By graphing network traffic through honeypot servers, patterns can be detected that will show anomalies that represent hackers. The combination of graph-based analysis, betweenness centrality calculations, and community detection provides powerful tools for identifying suspicious network behavior without requiring extensive manual feature engineering.
This project reinforced the value of unsupervised learning techniques and graph theory in cybersecurity—approaches that can adapt to new attack patterns and scale across different fraud detection domains.