This project webscrapes IMDB movie rankings using Python's BeautifulSoup package and merges this data with BoxOfficeMojo information related to movie box office grosses. I ran linear regression, decision tree, and random forest models using Scikit-Learn, achieving an R² of 82% which shows IMDB rankings and votes as important factors in predicting movie gross. Finally, I created a simple test case to predict what a fictional movie with certain ratings, opening figures, and vote counts would make in lifetime gross at the box office.
Table of Contents
Webscrape Movie Reviews From IMDB
# Webscraping/importing/system
from bs4 import BeautifulSoup
import requests
import pandas as pd
import os
import json
import pickle
# Graphing
%matplotlib inline
from matplotlib import pyplot as plt
import numpy as np
import pandas as pd
import seaborn as sns
from seaborn import plt
# Modeling
import statsmodels.formula.api as smf
import patsy
from sklearn import metrics
from sklearn import tree
from sklearn.linear_model import LinearRegression
from sklearn.cross_validation import train_test_split
from sklearn.ensemble import RandomForestRegressor
# Ignore Warnings
import warnings
warnings.filterwarnings('ignore')
def get_imdb_data():

#Sample website below:
#http://www.imdb.com/search/title?count=250&countries=us&languages=en&release_date
#=1972-01-01,2014-12-31&title_type=feature&view=simple&start=1

    base_url = "http://www.imdb.com/search/title"
    params = {
        "count": 250,
        "countries": "us",
        "languages": "en",
        "release_date": "1972-01-01,2014-12-31",
        "title_type": "feature",
        "view":"simple",
        "start": 1
    }
    data = []
    # Loop to navigate through pages by changing the start parameter
    while True:
        # Get content from IMDB
        content = requests.get(base_url, params=params).content
        params["start"] += 250

        soup = BeautifulSoup(content)

        # If no data is found, end the while loop
        if not soup.find("tr", class_=["even", "odd"]) or params["start"] > 10000:
            break

        # For each row (data), get title, ratings. Rows are tagged with even and odd class
        # tr = table row, td = table detail
        for tr in soup.find_all("tr", class_=["even", "odd"]):
            title_tag = tr.find("td", class_="title") # find td that has class = title
            title = title_tag.find("a").text # whatever is between is what I want

            # Get the Year. Strip the first and last value that contain the paranteses
            year = title_tag.find("span", class_="year_type").text[1:-1]

            # Get all td tags to get to rating and votes that don't have any class to them
            # No class names on rating
            td_tags = tr.find_all("td")
            # Get ratings.  If they don't exist, make empty string
            rating_tag = td_tags[2].find("b")
            if rating_tag:
                rating = rating_tag.text
            else:
                rating = ""
            # Get votes and remove the thousands seperator to get number
            votes = td_tags[3].text.strip().replace(",", "")
            # Append the results to data
            data.append({
                    "title": title,
                    "year": year,
                    "rating": rating,
                    "votes": votes
                })
    return data
data = get_imdb_data()
# Transform data to a dataframe, save as a pickle file
# pd.DataFrame(data)
# imdb = pd.DataFrame(data)
# with open('imdb1970.pkl', 'w') as picklefile:
#    pickle. dump(imdb, picklefile)
imdbfile = 'imdb1970.pkl'
assert os.path.isfile(imdbfile),'Oops, move your json or change the metafile path'
imdb_df = pd.DataFrame(pd.read_pickle(imdbfile))
imdb_df = imdb_df # same as mojo_df.transpose()
imdb_df.head()
print imdb_df.shape
print imdb_df.columns.values
Merging IMDB and BoxOfficeMojo Data
BoxOfficeMojo Data
mojofile = 'mojo_movies.pkl'
assert os.path.isfile(mojofile), 'Oops, move your pickle or change the mojofile path'
mojo_df = pd.DataFrame(pd.read_pickle(mojofile))
mojo_df = mojo_df.T # same as mojo_df.transpose()
mojo_df.head(2)
Check for Abnormalities
# Incorrect Dates
mojo_df.year.unique()
# turns out crazy date movies are 100 years off & full of nan's.
crazy_dates = mojo_df[mojo_df.year > 2016]
print len(crazy_dates)
crazy_dates.head(2)
mjdf = mojo_df.copy()
mjdf = mjdf[mjdf.year < 2017]
# Get important columns and change to more user friendly column names
col_names = [col.replace(' ','_') for col in mjdf.columns]
wanted = [2,3,5,6,9,10]
col_names = [col for i,col in enumerate(col_names) if i in wanted]
col_names_old = [col.replace('_',' ') for col in col_names]
mjdf = pd.DataFrame(mjdf[col_names_old].values,columns=col_names)
mjdf.head()
# 'n/a' in columns make each column an object type: Fix
mjdf.dtypes # Everything is an object
mjdf = mjdf.replace('n/a',np.nan)
mjdf.dtypes
# Drop Nans in Lifetime_gross column
mjdf = mjdf.dropna(subset=['lifetime_gross'])
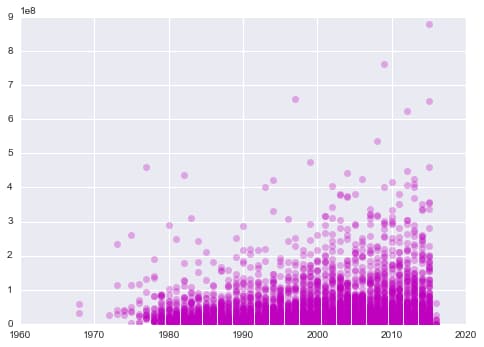
# Plot lifetime gross over the years
plt.plot(mjdf['year'],mjdf['lifetime_gross'],'mo',alpha=0.3);
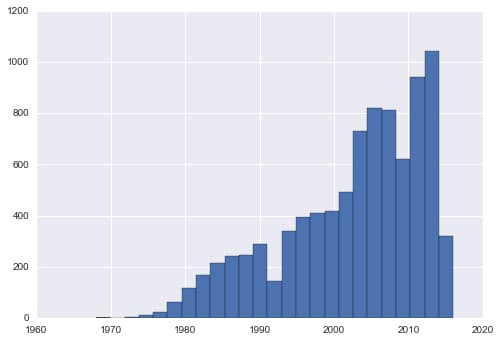
# Plot movies per year
mjdf.year.hist(bins=25);
Clean and Merge with IMDB Data
merged_on_raw_title = pd.merge(mjdf,imdb_df,on='title')
merged_on_raw_title.head(2)
# Function to create uniform title names
def lightly_process_title(title):
    title = title.replace(' ','').lower()
    charlist = list(title)
    charlist = [char for char in charlist if char.isalnum()]
    return ''.join(charlist)

t = "102 Dalmatians: A Puppy Comes-of-Age"
lightly_process_title(t)
imdb_df.loc[:,'title2'] = imdb_df.loc[:,'title'].apply(lightly_process_title)
mjdf['title2'] = mjdf['title'].apply(lightly_process_title)
merged_on_lighty_processed_title = pd.merge(mjdf,imdb_df,on='title2',how='inner')
merged_on_lighty_processed_title.head(2)
# Filter for relevant columns to model
combined = merged_on_lighty_processed_title
combined.columns
imdb_num = combined[['rating','votes','lifetime_gross','year_y','lifetime_gross_theaters','opening','opening_theaters']]
imdb_num.head(2)
imdb_num.info()
# Get rid of rows with '-'
imdb_copy = imdb_num
imdb_copy[imdb_copy.lifetime_gross_theaters == '-']
imdb_copy = imdb_copy[imdb_copy.lifetime_gross_theaters != '-']
imdb_copy = imdb_copy[imdb_copy.opening_theaters != '-']
imdb_copy[imdb_copy.opening_theaters == '-']
imdb_copy.head(2)
# print imdb_copy.isnull() # boolean true/fales
# print imdb_copy.isnull().any(axis=1) # single col of true/falses depending on any nulls in rows
# print imdb_copy.isnull().any(axis=1).nonzero() # return rows that are non zero or 1 for true
# print imdb_copy.isnull().any(axis=1).nonzero()[0] # take first element of array
print imdb_copy.opening.shape
print imdb_copy.isnull().any(axis=1).nonzero()[0]
# check a row with Nan
imdb_copy.iloc[567,:]
# drop Nans, create final df
imdb_copy.dropna().info()
imdb_final = imdb_copy.dropna()
# Change dtypes
imdb_final['rating'] = imdb_final['rating'].map(lambda x: float(x))
imdb_final['votes'] = imdb_final['votes'].map(lambda x: int(x))
imdb_final['lifetime_gross'] = imdb_final['lifetime_gross'].map(lambda x: int(x))
imdb_final['year_y'] = imdb_final['year_y'].map(lambda x: int(x))
imdb_final['lifetime_gross_theaters'] = imdb_final['lifetime_gross_theaters'].map(lambda x: int(x))
#imdb_final['opening'] = imdb_final['opening'].map(lambda x: float(x))
imdb_final['opening_theaters'] = imdb_final['opening_theaters'].map(lambda x: int(x))
imdb_final.info()
Predictive Models
Regression - Scikit-Learn - 82% R²
features = ['votes', 'rating','year_y','lifetime_gross_theaters','opening','opening_theaters']
response = ['lifetime_gross']
# Create an empty model
lin_reg = LinearRegression()
# Choose the predictor variables, here all but the first which is the response variable
X = imdb_final[features]
# Choose the response variable(s)
y = imdb_final[response]
# Fit the model to the full dataset. Unlike statsmodel, have to give it the data
lin_reg_results = lin_reg.fit(X, y)
# Print out the R^2 for the model against the full dataset
lin_reg.score(X,y)
Regression - Scikit-Learn - Add Predictions
predictions = lin_reg.predict(X)
len(predictions) # 3958
imdb_final['predictions'] = predictions
imdb_final['predictions'] = imdb_final['predictions'].astype(int)
imdb_final.head(2)
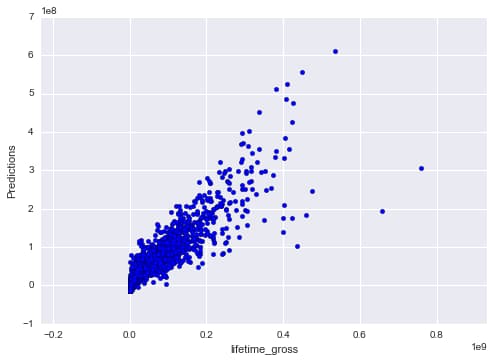
# Scikit Learn Predictions/Fit Plots shows predictions being relatively accurate
# Plot Predictions vs Fit
fig, ax = plt.subplots(1, 1)
ax.scatter(imdb_final['lifetime_gross'],imdb_final['predictions'])
ax.set_xlabel('lifetime_gross')
ax.set_ylabel('Predictions')
ax.axis('equal')
lin_reg.intercept_
lin_reg.coef_
imdb_final[['lifetime_gross','predictions']].head(2)
# R Squared - Same as above
metrics.r2_score(imdb_final['lifetime_gross'], imdb_final['predictions'])
# MSE
np.sqrt(metrics.mean_squared_error(imdb_final['lifetime_gross'], imdb_final['predictions']))
# MAE - Scikit Learn
metrics.mean_absolute_error(imdb_final['lifetime_gross'], imdb_final['predictions'])
Regression - StatsModels - Residual Plots
# Define the model
model = smf.ols('lifetime_gross ~ votes + rating + year_y + lifetime_gross_theaters + opening + opening_theaters', data=imdb_final)
# Fit the model
fit = model.fit()
# Check out the results
fit.summary()
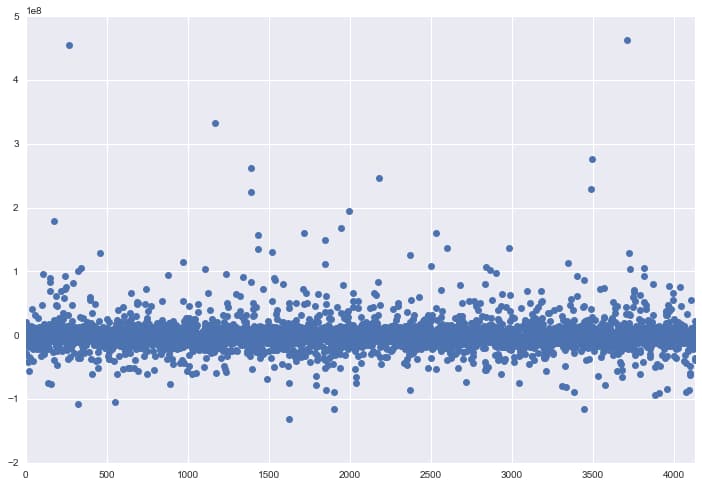
# Use statsmodels to plot the residuals
# Accurate because most dots around zero
fit.resid.plot(style='o', figsize=(12,8))
Regression - StatsModels - Array Method
Feature Importance Based on P-Values - Votes Most Important Feature
X2=X
X2["Index"] = 1
X2.head(2)
lm = smf.OLS(np.array(y), np.array(X2))
results = lm.fit()
results.summary()
results.params
results.rsquared
# confidence intervals of coefficients
results.conf_int()
zip(features, lin_reg.coef_)
# Sorted P-Values
sorted_pvalues = sorted(results.pvalues)
pvalues_results = sorted_pvalues[1:]
pvalues_results
#Sort by best pvalue features dataFrame
p = pd.DataFrame({'p_value':pvalues_results, 'feature':features})
p
relevant_features = list(p[p.p_value < .05]['feature'])
relevant_features
Decision Trees
Decision Tree Model gives lower R² of 60.5% and depicts different feature importance set
# split the data into training and test sets
X_train, X_test, y_train, y_test = train_test_split(X,y, random_state=1)
# Create a decision tree classifier instance (start out with a small tree for interpretability)
ctree = tree.DecisionTreeRegressor(random_state=1)
# Fit the decision tree classifier
ctree.fit(X_train, y_train)
# Create a feature vector
features2 = X_train.columns.tolist()
features2
# predictions_tree
predictions_tree = ctree.predict(X_test)
# R Squared - Scikit Learn
metrics.r2_score(y_test, predictions_tree)
# MAE
metrics.mean_absolute_error(y_test, predictions_tree)
# MSE
np.sqrt(metrics.mean_squared_error(y_test, predictions_tree))
# Which features are the most important?
# Clean up the output. # will add up to 1. Think %
pd.DataFrame(zip(list(X.columns), ctree.feature_importances_)).sort_values(by=1, ascending=False)
Random Forest
Random Forest Model gives slightly lower R² of 78.7% and depicts different feature importance set
rfclf = RandomForestRegressor(n_estimators=100, max_features='auto', oob_score=True, random_state=1)
rfclf.fit(X_train, y_train)
predictions_tree = rfclf.predict(X_test)
# R2
metrics.r2_score(y_test, predictions_tree)
# MEA
metrics.mean_absolute_error(y_test, predictions_tree)
# MSE
np.sqrt(metrics.mean_squared_error(y_test, predictions_tree))
# compute the feature importances
rf_feature_imp = pd.DataFrame(zip(list(X.columns), rfclf.feature_importances_)).sort_index(by=1, ascending=False)
rf_feature_imp
Simple Test Case
Simple test case of a 9 star rating with a $10,000,000 opening and 150,000 votes is predicted to make about $120 million in lifetime gross
X_sub_features = imdb_final[['rating', 'opening', 'votes']]

X_train, X_test, y_train, y_test = train_test_split(X_sub_features,y, random_state=1)
rfclf = RandomForestRegressor(n_estimators=100, max_features='auto', oob_score=True, random_state=1)
rfclf.fit(X_train, y_train)

predictions_tree = rfclf.predict(X_test)
metrics.r2_score(y_test, predictions_tree)

# To Predict a Movie Revenue
rfclf.predict([9, 10000000, 150000])[0]
rfclf.feature_importances_
Conclusion
This project successfully demonstrated the power of combining web scraping with machine learning to predict movie box office performance. By merging IMDB ratings data with BoxOfficeMojo financial information, I was able to build predictive models that achieved strong performance metrics.
Key findings from this analysis:
- Linear Regression performed best with an R² of 82%, indicating that the selected features explain a significant portion of the variance in lifetime gross revenue.
- IMDB votes emerged as the most important predictor based on p-value analysis, suggesting that audience engagement is a stronger indicator of box office success than critical ratings alone.
- Random Forest models achieved 78.7% R², slightly lower than linear regression but still demonstrating good predictive capability with a different feature importance ranking.
- Decision Trees underperformed at 60.5% R², likely due to overfitting on the training data.
The practical test case validated the model's utility—predicting that a hypothetical movie with a 9-star rating, $10 million opening, and 150,000 votes would generate approximately $120 million in lifetime gross. This type of prediction could be valuable for studios and investors evaluating potential film projects.
Future improvements could include incorporating additional features like genre, director track record, marketing budget, and release timing to further enhance prediction accuracy.